 Stay
Stay 
Trading Conditions
Products
Tools


GOLD
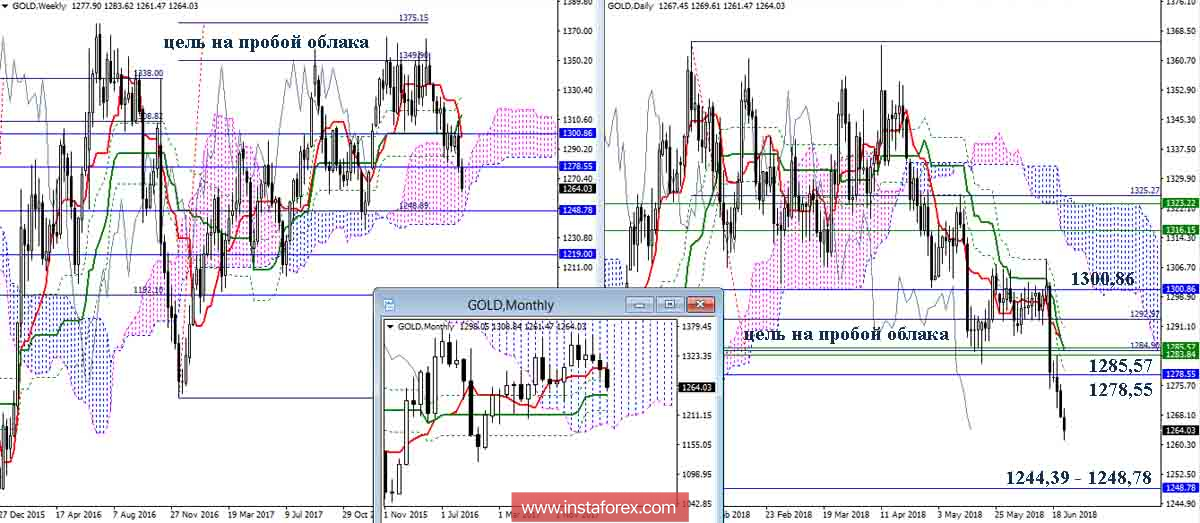
Having reached the downward target on the breakdown of the day's cloud, gold begin the correction and break down. Earlier, it was noted that the major resistance in this area is 1300.86 (weekly Kijun + monthly Tenkan + day Kijun). At present, we can see that the bears managed to keep this important breakthrough. As a result, players continued to decline with new strength, realizing the breakdown of the support zone due to retesting the broken weekly golden cross (1300.86) and holding the death cross' ability to work, which previously led to correction (1285.57-1278.55 Fibo Kiju weeks and months + level of 100% daily goal). At the moment, the levels of 1285.57 - 1278.55 will form a strengthened line of resistance in case that rising players recovered their positions. The main reference points for the decline are the lower boundary of the weekly cloud (1244.39) and the monthly Kijun (1248.78).
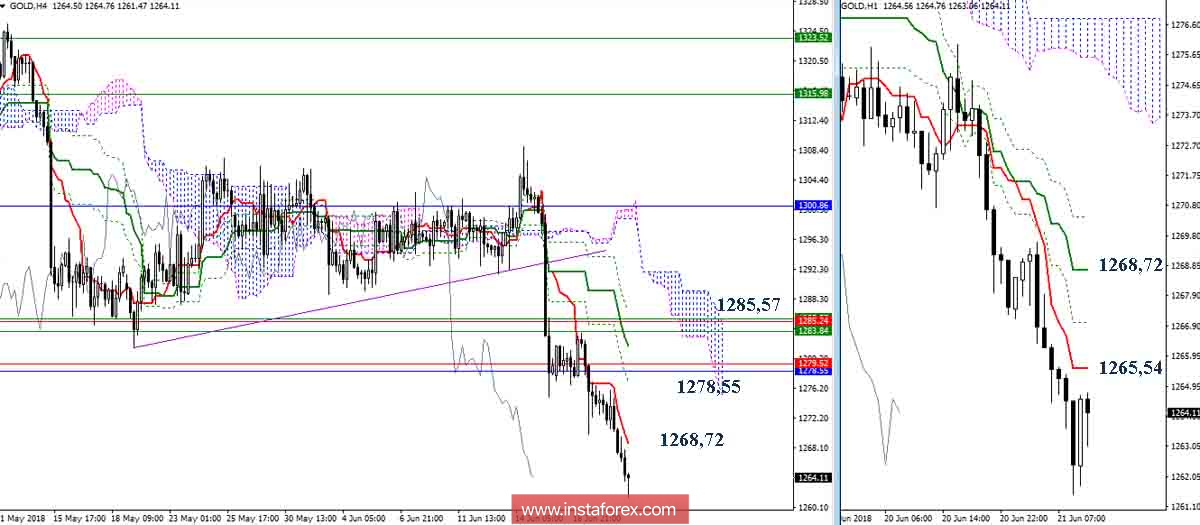
The lower time intervals are currently in favor with the support of bearish sentiments. The downward targets and landmarks have long been worked out. In the case of an upward correction, the levels H1 and H4 will be the first to enter the work. Today, the resistance can be seen at 1265.54 (Tenkan N1) and 1268.72 (Tenkan N4 + Kijun N1).
Indicator parameters:
all time intervals 9 - 26 - 52
Color of indicator lines:
Tenkan (short-term trend) - red,
Kijun (medium-term trend) - green,
Fibo Kijun is a green dotted line,
Chinkou is gray,
clouds: Senkou Span B (SSB, long-term trend) - blue,
Senkou Span A (SSA) - pink.
Color of additional lines:
support and resistance MN - blue, W1 - green, D1 - red, H4 - pink, H1 - gray,
horizontal levels (not Ichimoku) - brown,
trend lines - purple.
* The presented market analysis is informative and does not constitute a guide to the transaction.
InstaForex analytical reviews will make you fully aware of market trends! Being an InstaForex client, you are provided with a large number of free services for efficient trading.


