 Stay
Stay 
Trading Conditions
Products
Tools


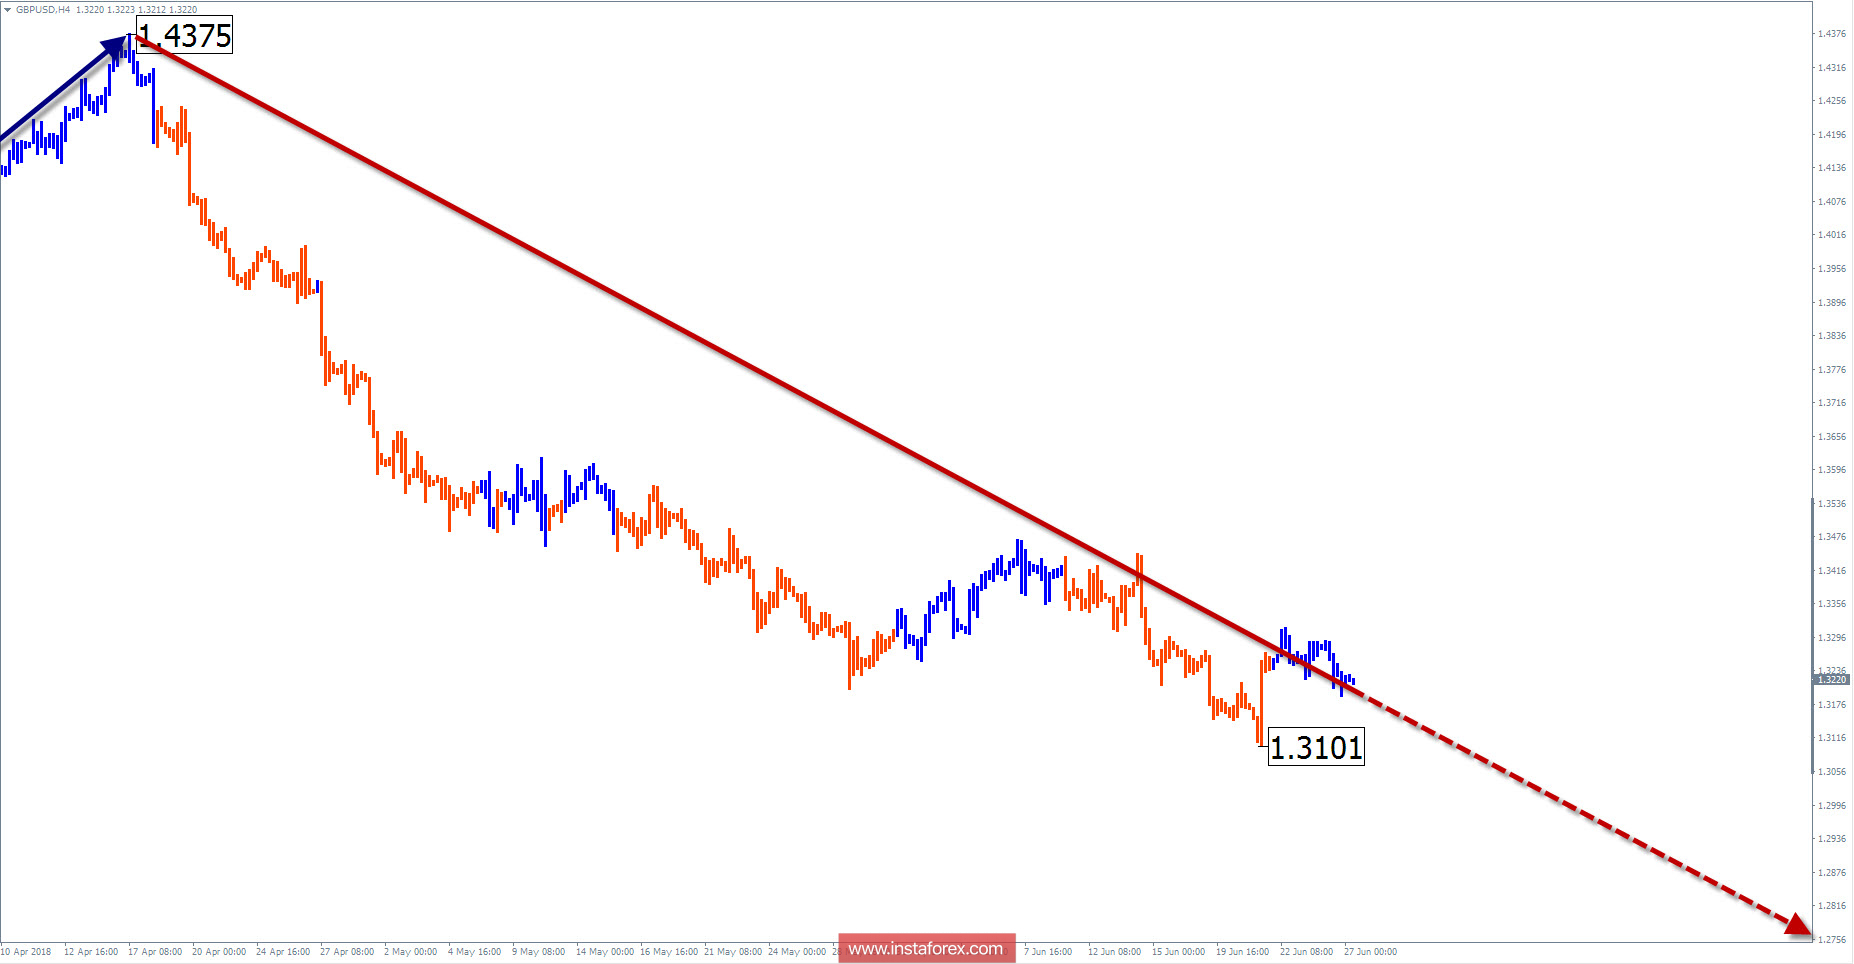
The wave pattern of the H4 graph:
The direction of the short-term trend is indicated by the bearish wave of the instrument emerging from January 25. The preliminary target zone is approximately in 5 price figures below the current price values.
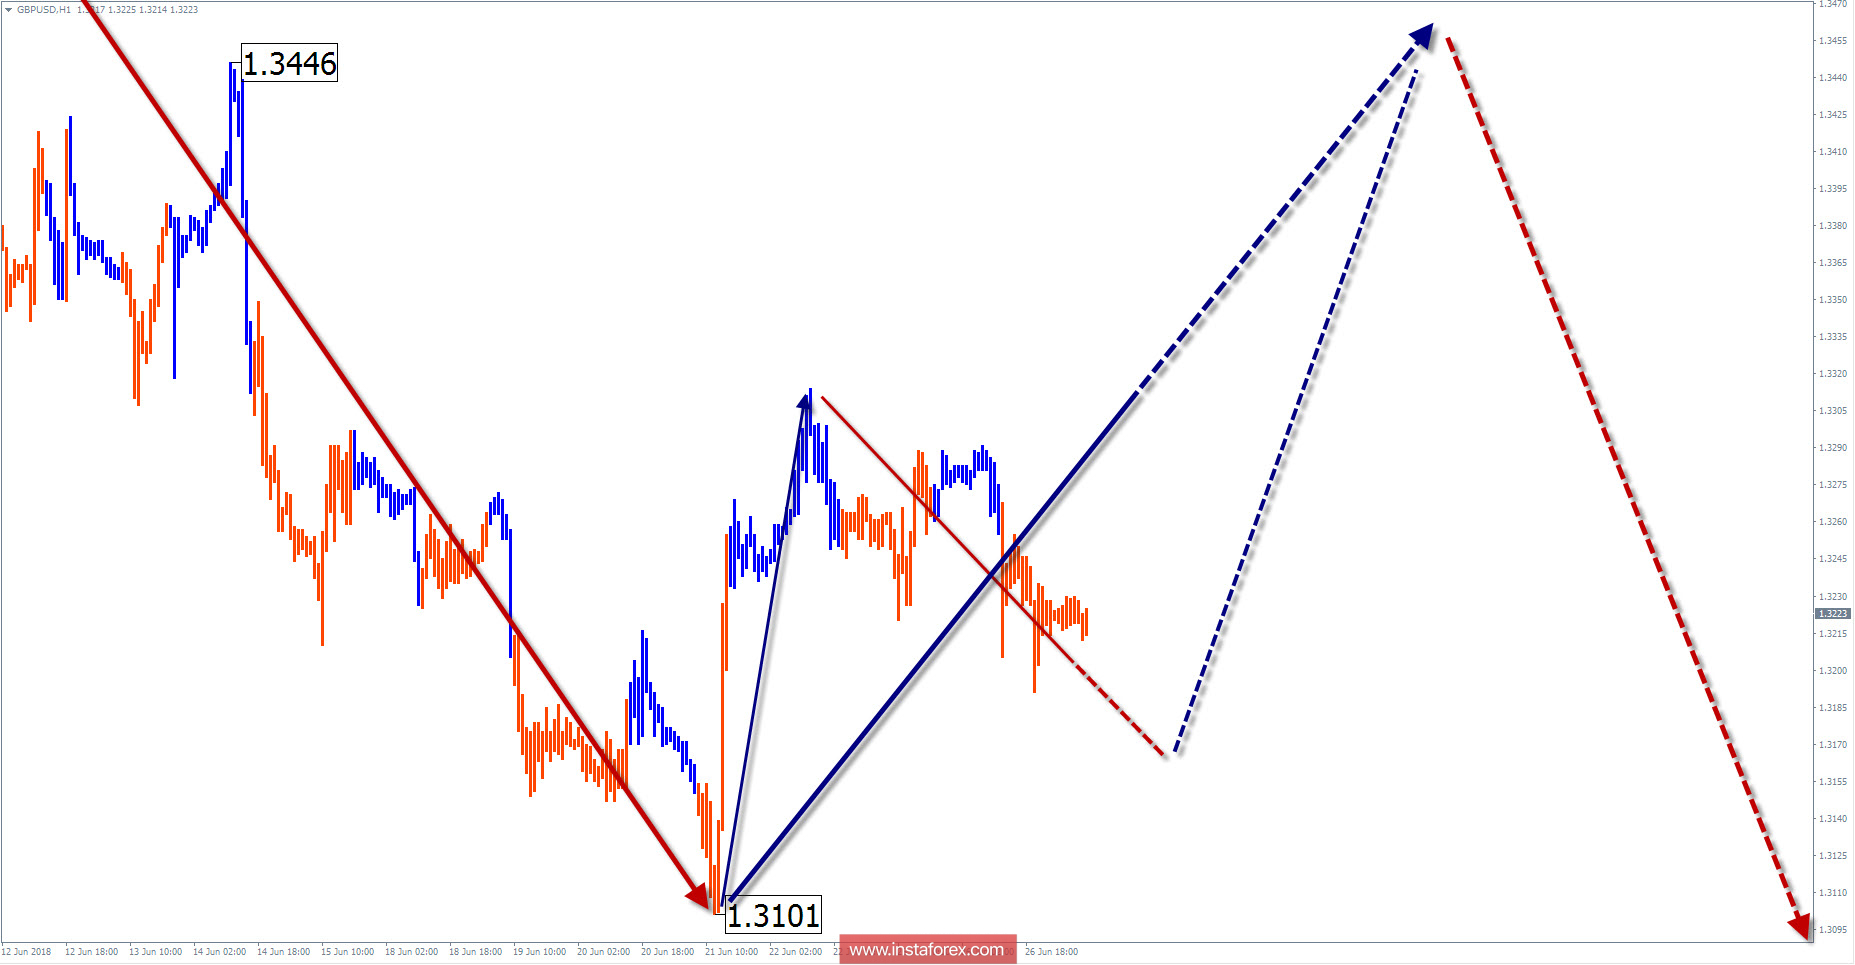
The wave pattern of the H1 graph:
The bearish wave of April 17 in higher timeframe takes the place of the final part (C). In the last month, the price forms a counter correction in a wrong form, in which the final lift is lacking.
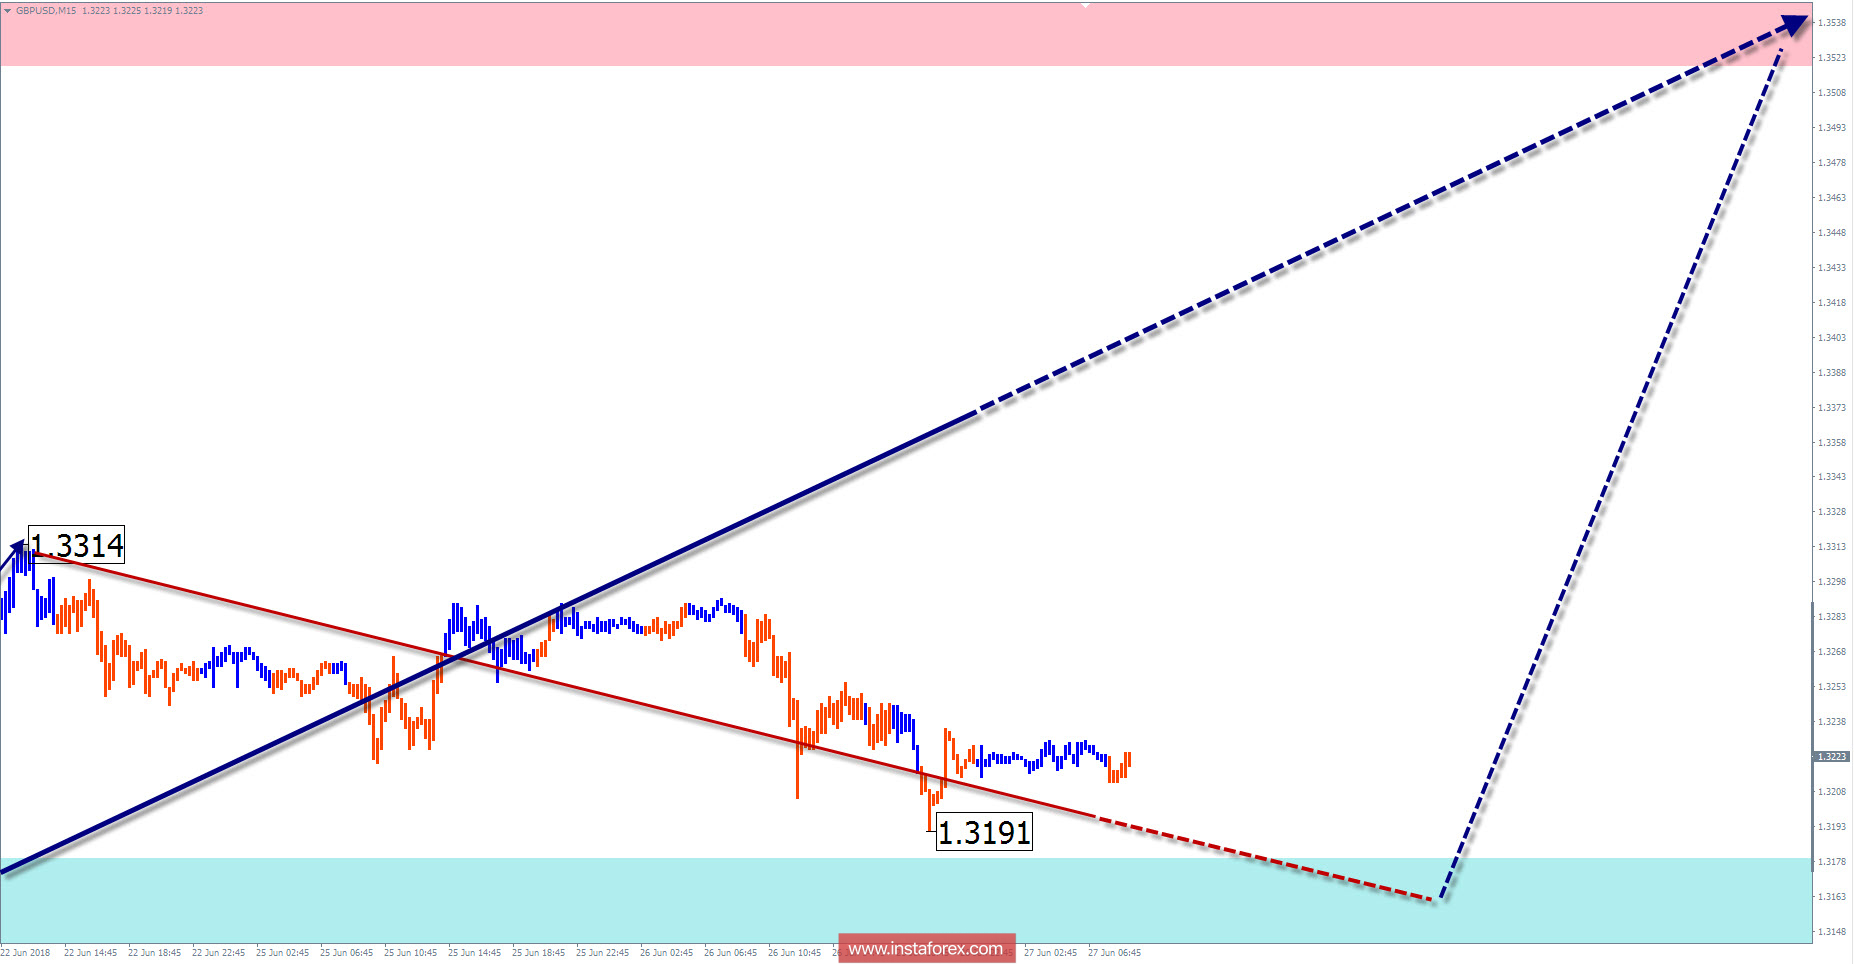
The wave pattern of the M15 chart:
The ascending section from June 21st started the bullish wave. The lifting potential is limited by the design resistance.
Recommended trading strategy:
Purchases are risky and they can only be used in inter-session trading. It is better to look for signals for the sale of the pair in trading in higher sections of the schedule in order to roll back up.
Resistance zones:
- 1.3520 / 1.3570
Support zones:
- 1.3180 / 1.3130
Explanations to the figures:
A simplified wave analysis uses a simple waveform, in the form of a 3-part zigzag (ABC). The last incomplete wave for every timeframe is analyzed. Zones show the calculated areas with the greatest probability of a turn.
Arrows indicate the counting of wave according to the technique used by the author. The solid background shows the generated structure and the dotted exhibits the expected wave motion.
Attention: The wave algorithm does not take into account the duration of the tool movements in time. To conduct a trade transaction, you need to confirm the signals used by your trading systems.
InstaForex analytical reviews will make you fully aware of market trends! Being an InstaForex client, you are provided with a large number of free services for efficient trading.

