 Stay
Stay 
Trading Conditions
Products
Tools


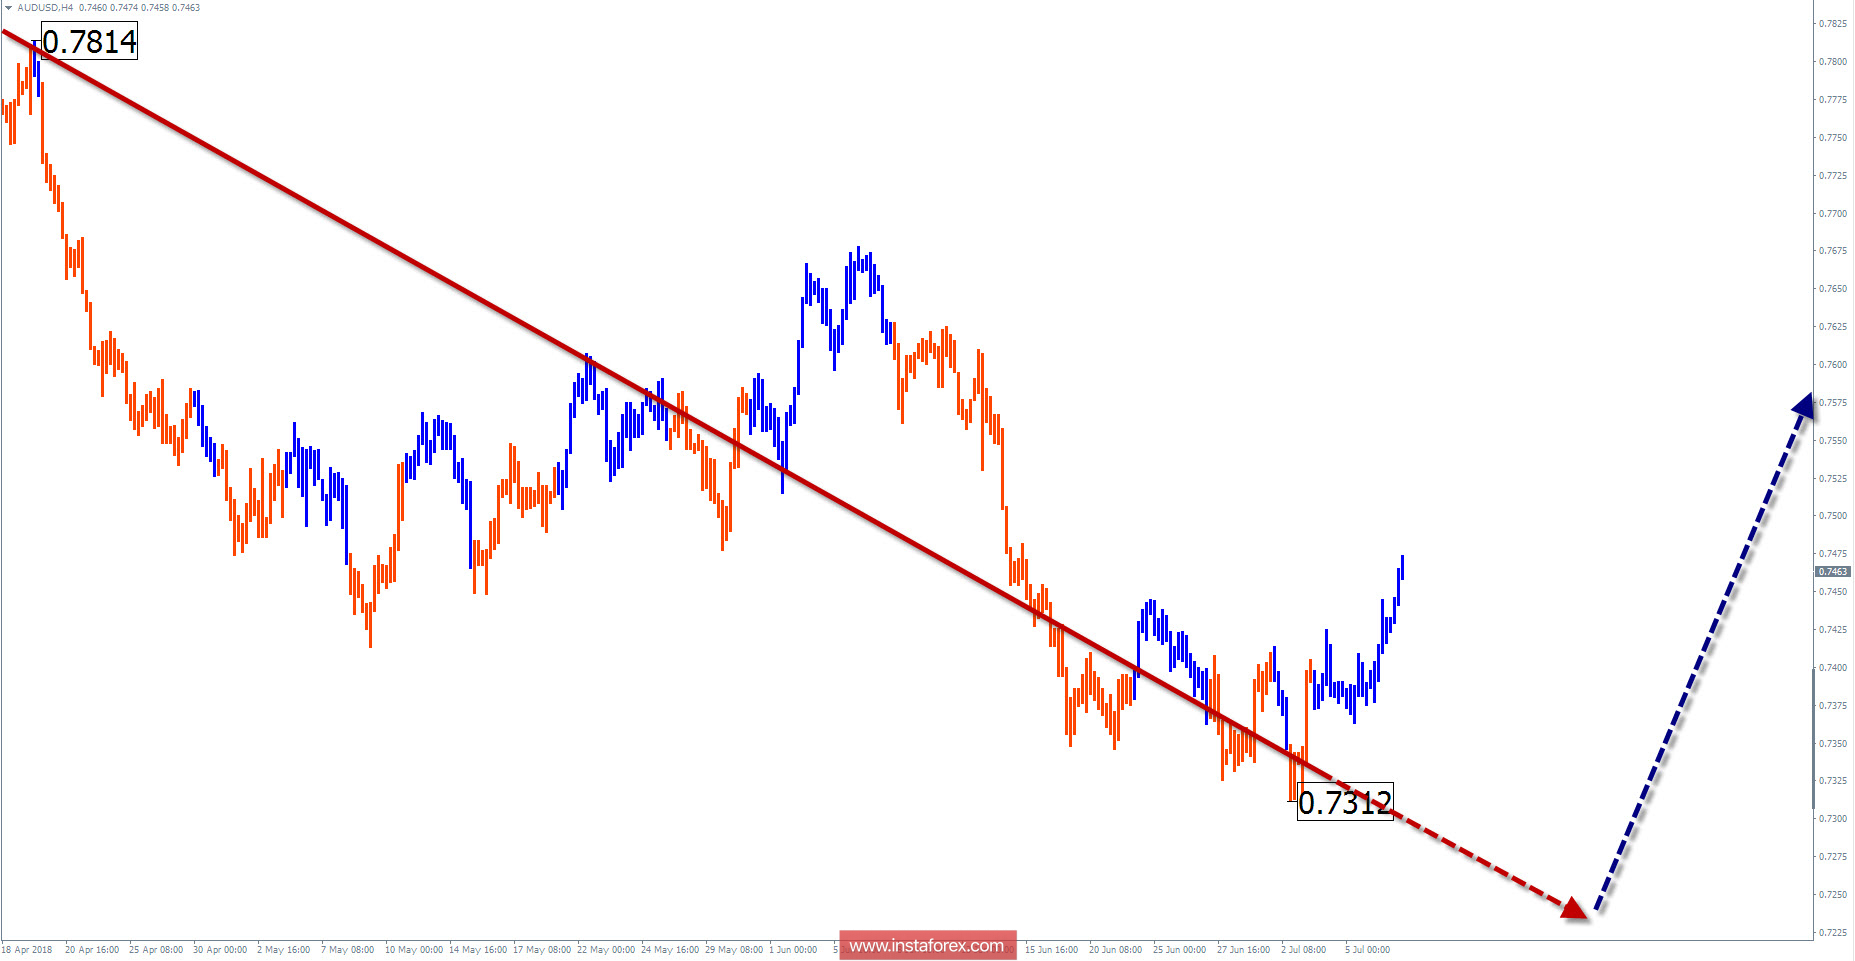
The wave pattern of the H4 graph:
Since January 26, the trend is bearish and the price reached the likely turn in the upper limit of the calculation area. The structure of the wave is not complete.
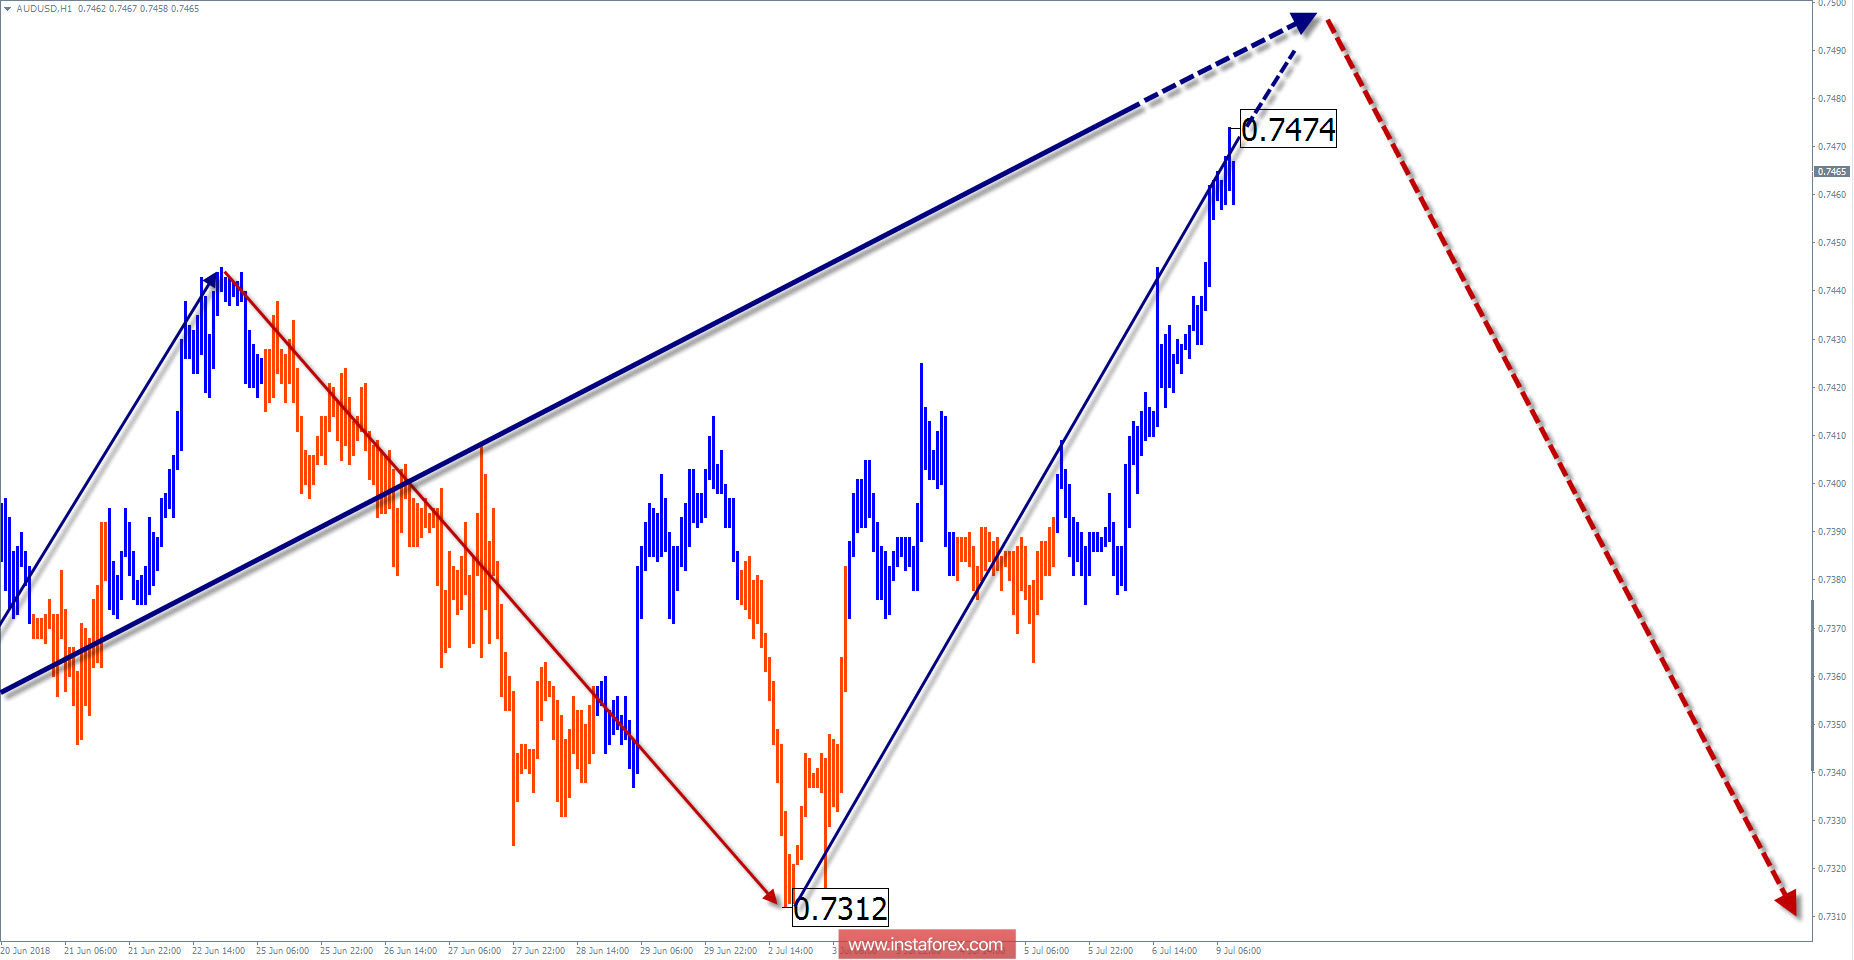
The wave pattern of the graph H1:
In the wave of June 6, an average corrective part was formed. Then, the trend of the wave will continue.
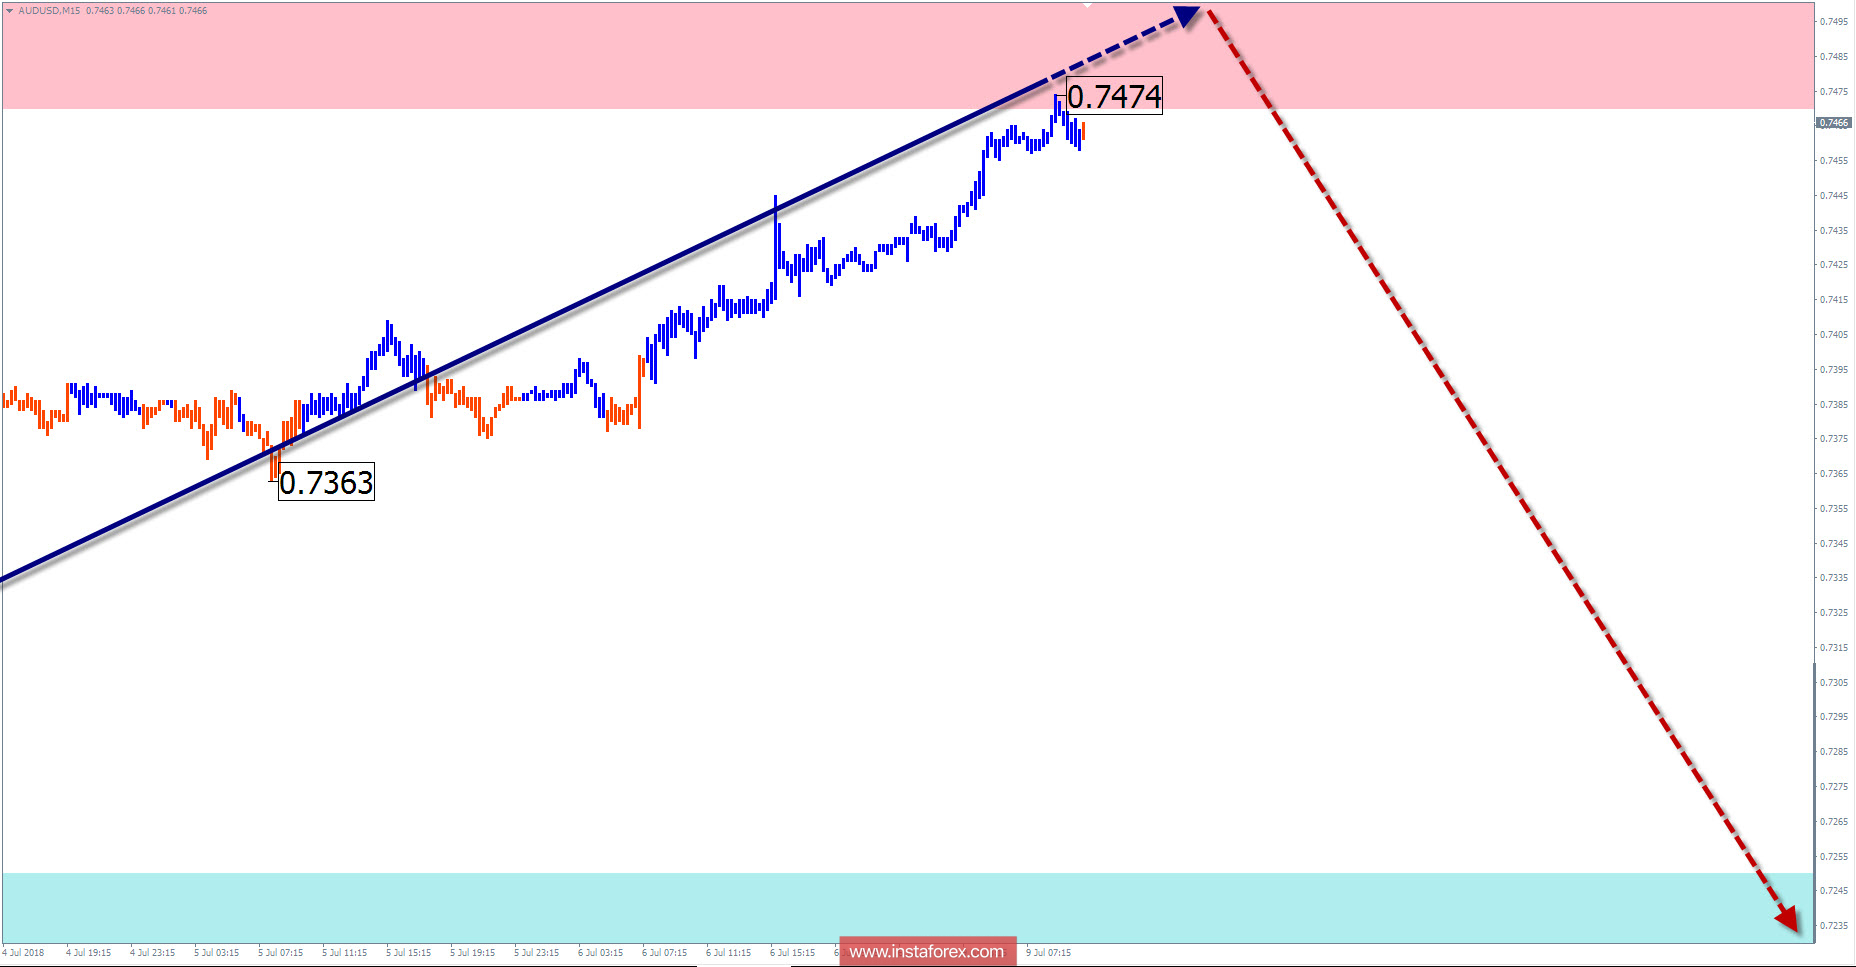
The wave pattern of the M15 chart:
The rising wave from July 2 reached the lower limit of the calculated resistance zone. In the coming days, a change in the price movement vector is expected.
Recommended trading strategy:
Short-term trading needs to track to sell the pair. Supporters of trade on higher timeframes should wait for the signals of the completion of the current bearish wave before buying the pair.
Resistance zones:
- 0.7470 / 0.7520
Support zones:
- 0.7250 / 0.7200
Explanations to the figures:
A simplified wave analysis uses a simple waveform, in the form of a 3-part zigzag (ABC). The last incomplete wave for every time frame is analyzed. Zones show the calculated areas with the greatest probability of a turn.
Arrows indicate the counting of wave according to the technique used by the author. The solid background shows the generated structure and the dotted exhibits the expected wave motion.
Attention: The wave algorithm does not take into account the duration of the tool movements in time. To conduct a trade transaction, you need to confirm the signals used by your trading systems.
InstaForex analytical reviews will make you fully aware of market trends! Being an InstaForex client, you are provided with a large number of free services for efficient trading.

