 Stay
Stay 
Trading Conditions
Products
Tools


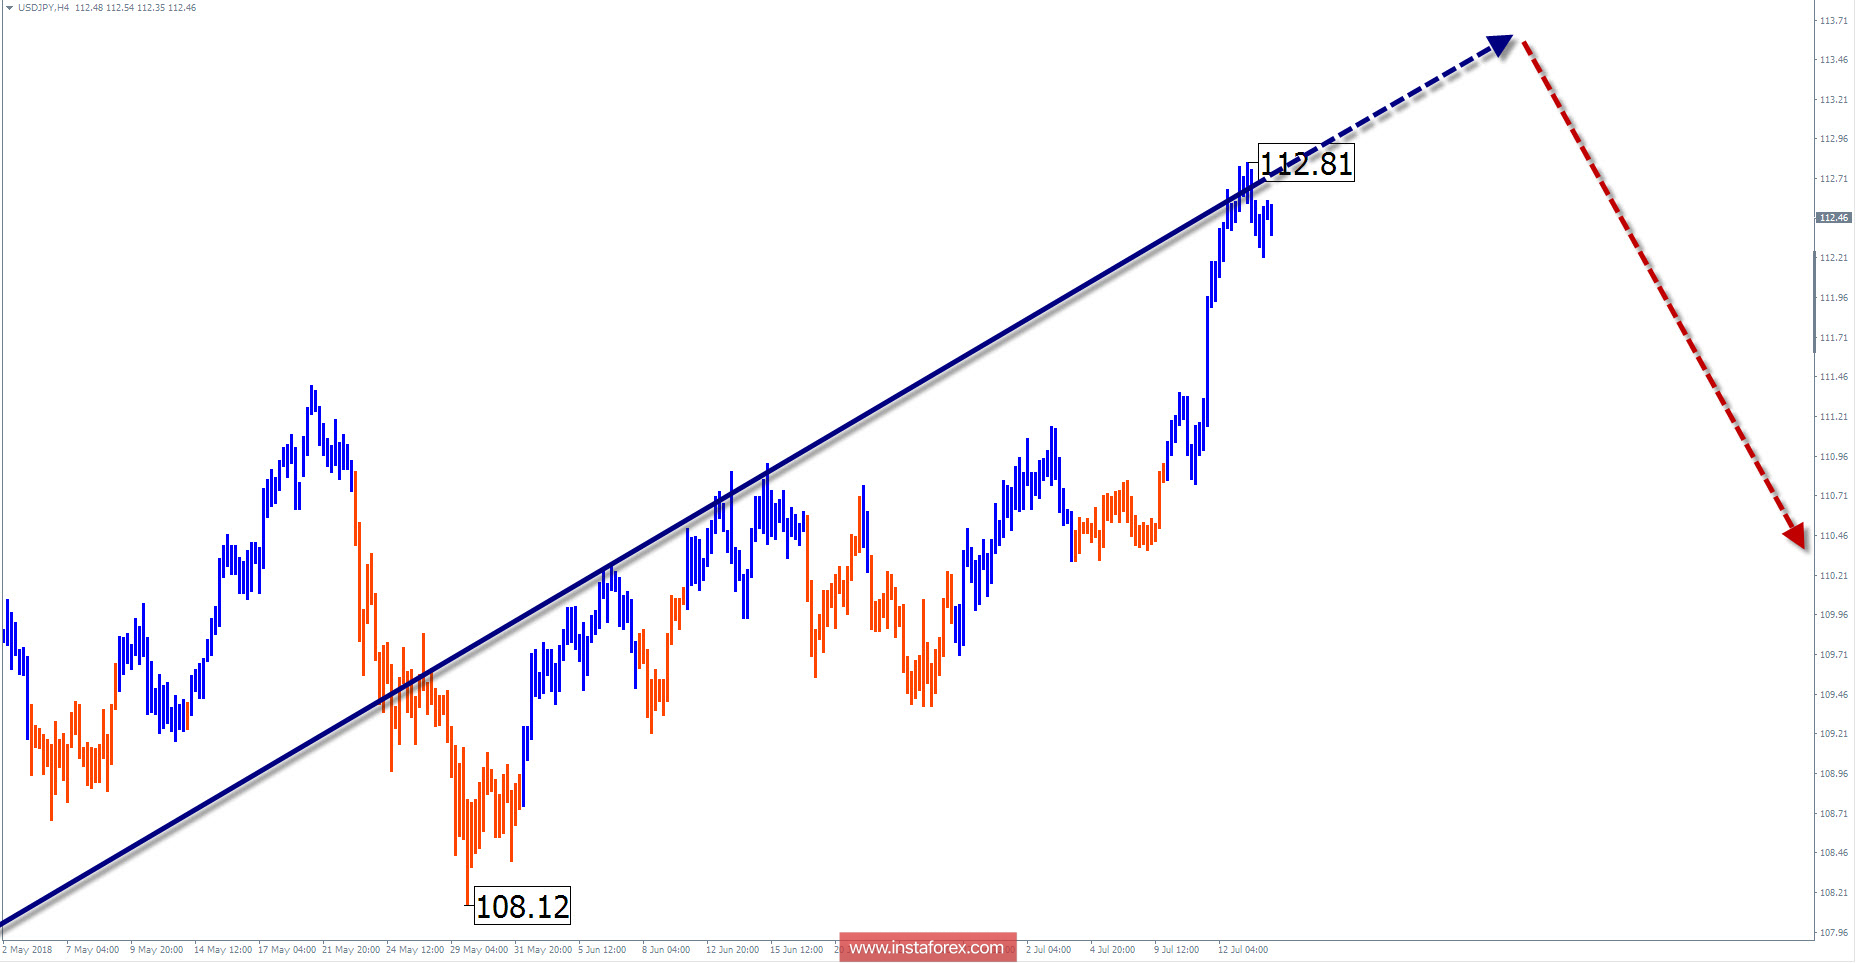
Wave picture of the chart H4:
The direction of the trend of the yen major from the middle of February indicates the "north" of the chart. The price is near the lower boundary of the target zone.
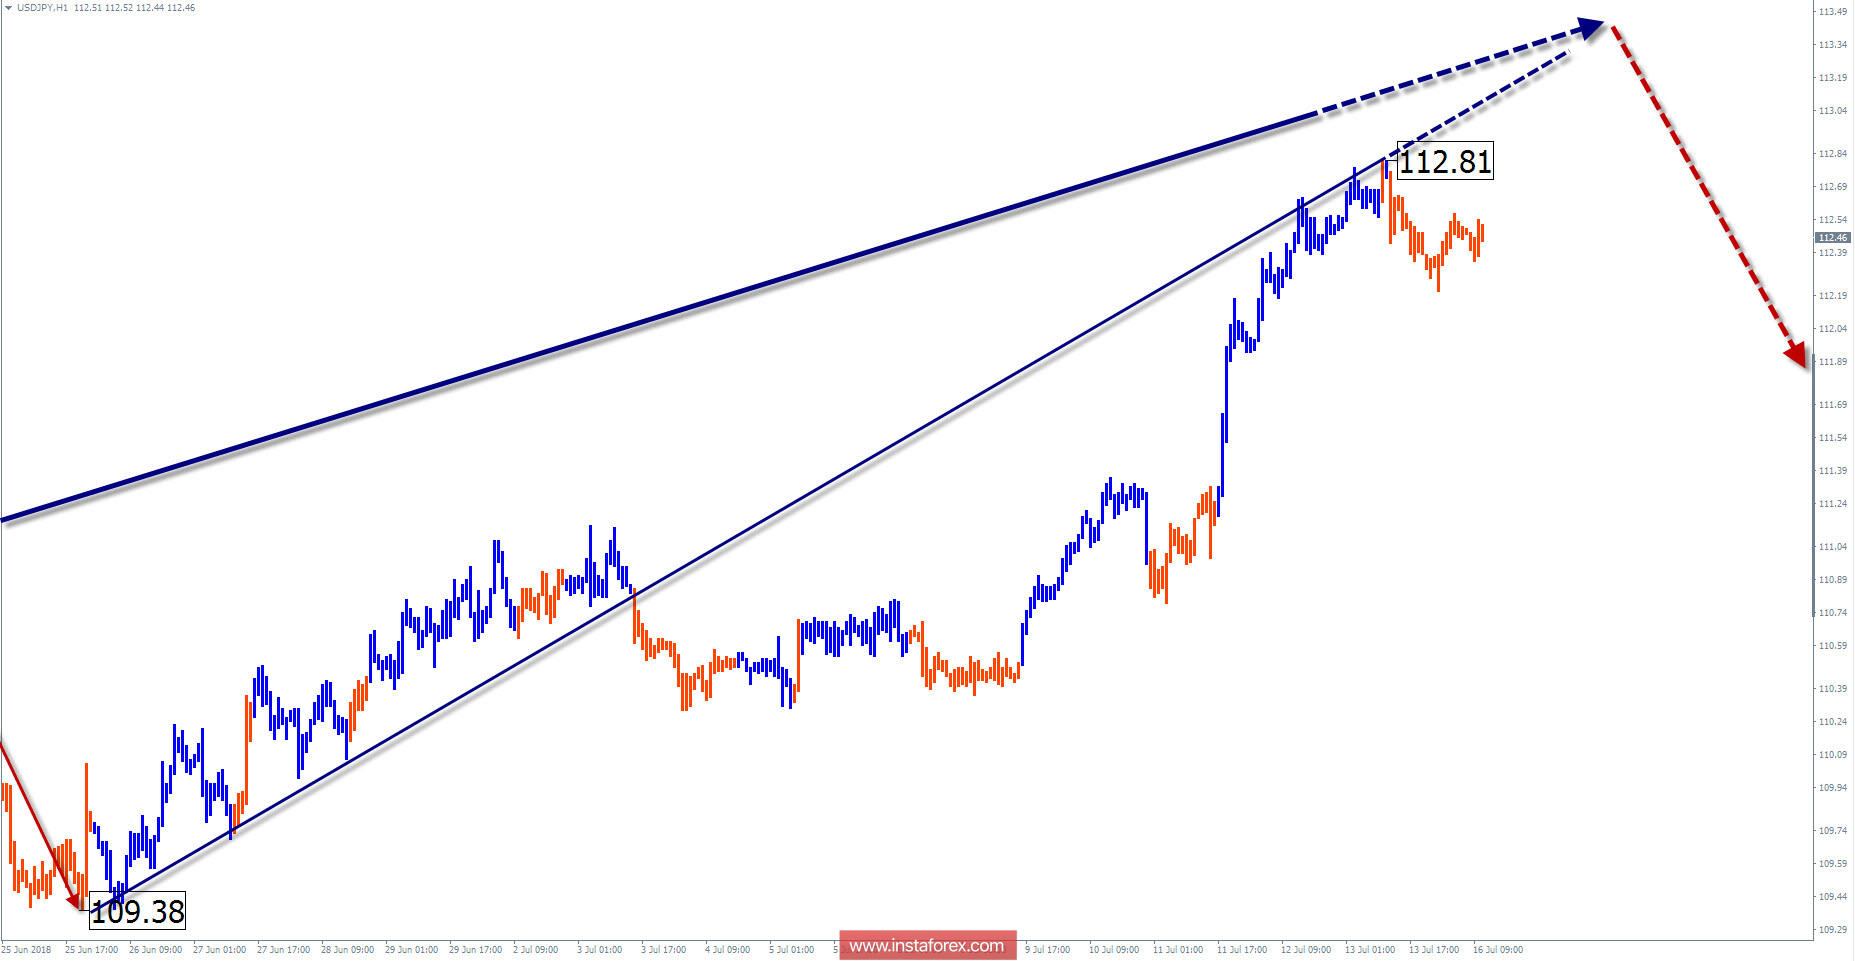
The wave pattern of the graph H1:
The rising wave of May 29 forms the final part (C) in a larger model. The structure of the wave by now looks complete.
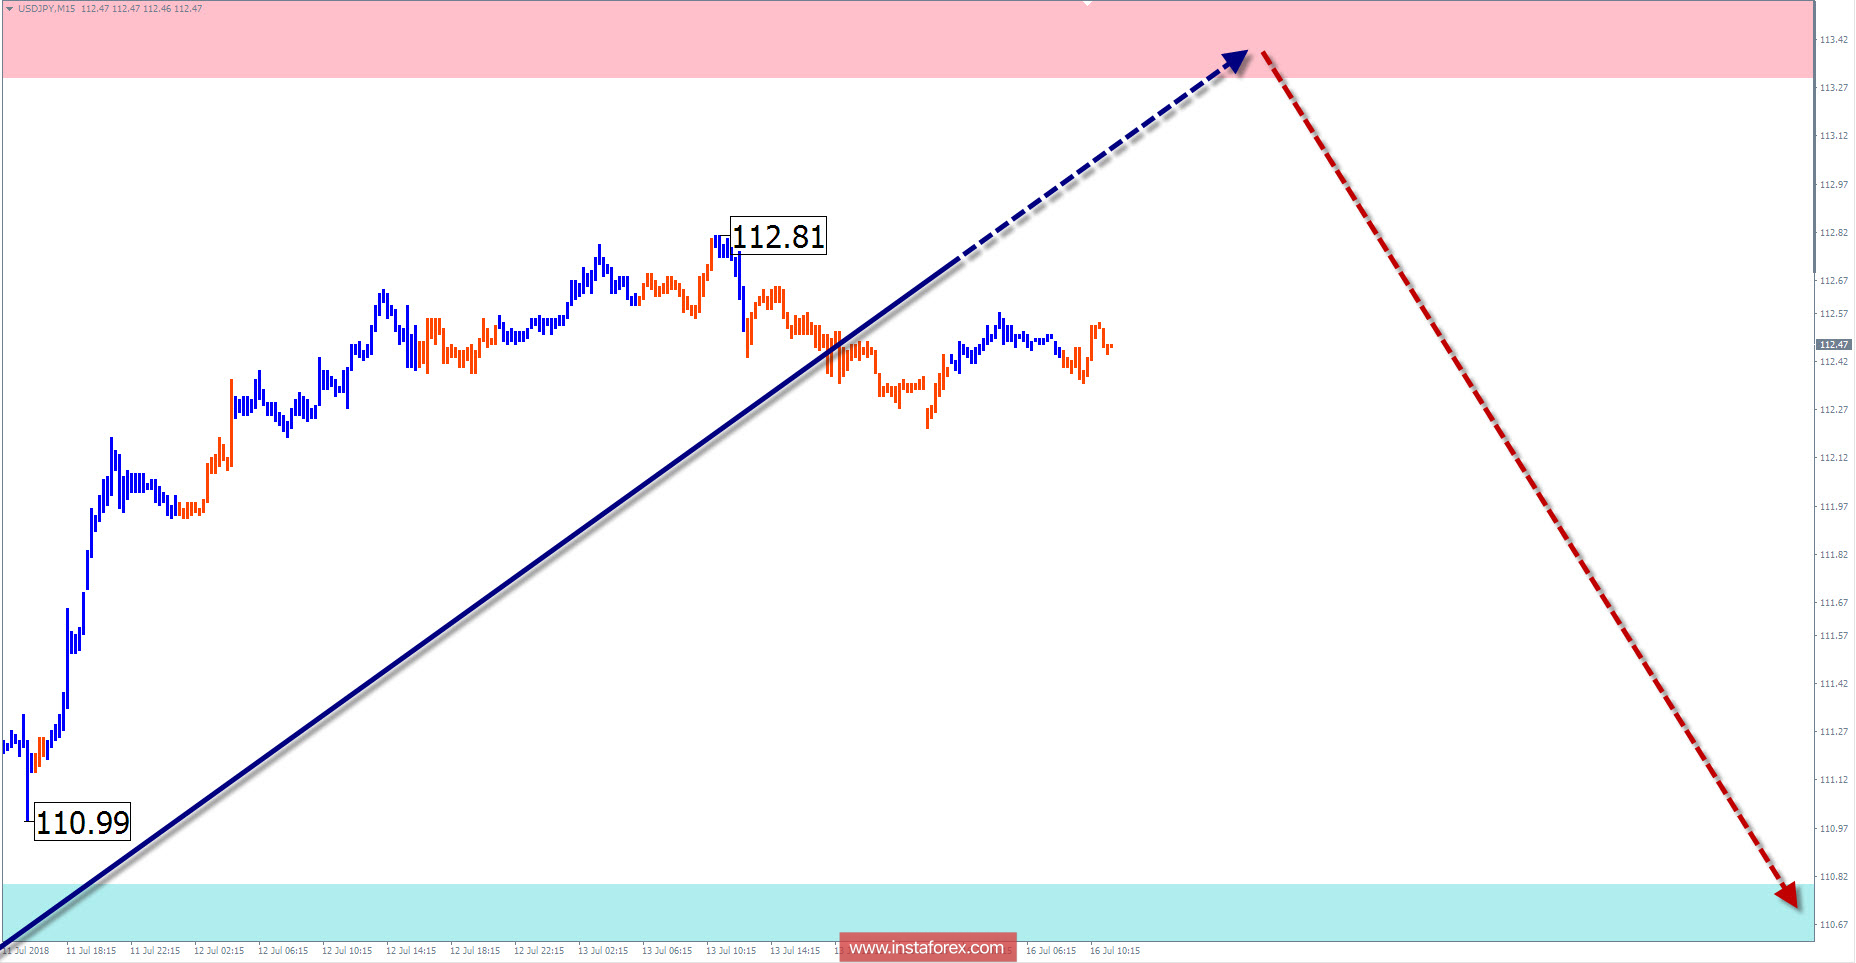
The wave pattern of the M15 chart:
The rising wave of June 25 is approaching the calculated zone of a potential reversal. Further, at least, we should wait for a correction within this wave.
Recommended trading strategy:
In the coming days, supporters of long-term transactions will need to hedge, or close the previously opened purchases. Proponents of inter-session trade will have the opportunity to make short-term sales of the instrument.
Resistance zones:
- 113.30 / 113.80
Support zones:
- 110.80 / 110.30
Explanations to the figures: In a simplified wave analysis, waves consisting of 3 parts (A-B-C) are used. For analysis, 3 main TFs are used, on each one the last, incomplete wave is analyzed. Zones show the calculated areas with the greatest probability of a turn.
Arrows indicate the wave counting according to the technique used by the author. The solid background shows the generated structure, the dotted - the expected movements.
Attention: The wave algorithm does not take into account the duration of the tool movements in time. To conduct a trade transaction, you need confirmation signals from your trading systems!
InstaForex analytical reviews will make you fully aware of market trends! Being an InstaForex client, you are provided with a large number of free services for efficient trading.


