 Stay
Stay 
Trading Conditions
Products
Tools


4-hour timeframe
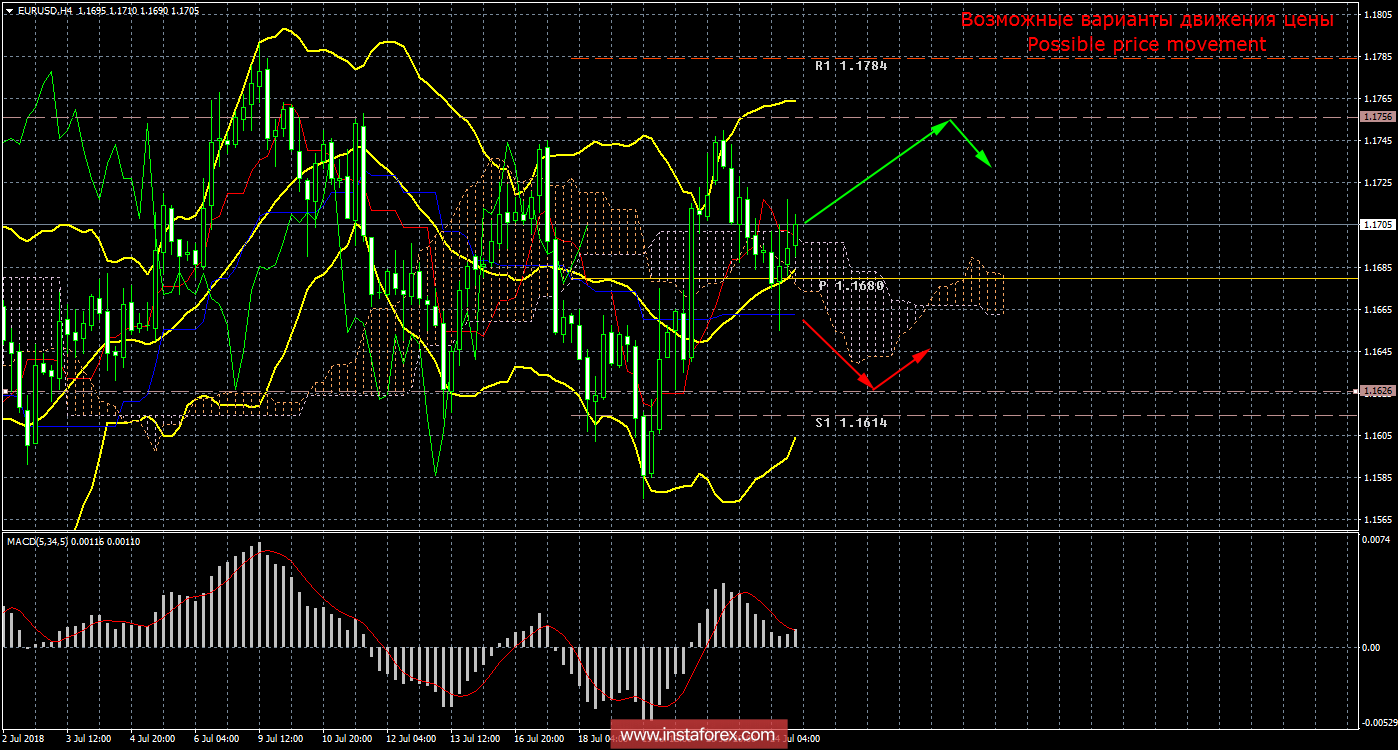
Amplitude of the last 5 days (high-low): 96p - 63p - 100p - 112p - 66p.
The average amplitude for the last 5 days is 87n (84p).
The movement on the currency pair on July 25 can be described as multidirectional. Although from a technical point of view, everything is perfect. The price worked out the critical Kijun-sen line and jumped from it, resuming the upward movement and working out the signal to buy from Ichimoku. European indices of business activity exerted little pressure on the euro. IDA in the service sector declined in July to 54.4, composite to 54.3. And only the index of business activity in the production sector rose to 55.1. However, these news were not the main ones during the day. As always, interesting information came from the White House. This time, US President Donald Trump threatened to increase trade duties for the European Union to $ 300 billion. Trump plans to increase duties on the import of cars from Europe to 20%. And he is going to introduce these trade restrictions, if the EU does not completely remove all duties on the import of American goods. Tomorrow, European Commission President Jean-Claude Juncker will pay an official visit to the US, within which he will try to negotiate with Trump. If negotiations fail, then, most likely, the trade conflict will expand from the China-US zone to the US-China-EU zone. Traders reacted to this news by selling US dollar. This is a good sign, since seeing the growth of the dollar at a time when Trump imposes sanctions against everyone is a little strange and illogical. At the same time, we remind that the US leader often adheres to the principle "My word. I want to give, I want to take it back." Threats to impose sanctions on all imports from China, as well as on a huge amount from Europe look already implausible. No, we do not believe that Trump is bluffing, but still for a few months to impose duties on all imports from the EU and China and expect that no response will be made, at least naive. Thus, we believe that Trump adheres to his strategy, which consists of threats that, in the course of time, will be weakened in exchange for concessions from China and the EU. Anyway, the dollar in the coming weeks may be under significant pressure.
Trading recommendations:
For the currency pair EUR / USD, the downward correction is completed. Thus, we expect today-tomorrow to move upwards with the target of 1.1766. It is recommended to consider long positions, as the price eloquently rebounded from the critical Kijun-sen line.
Orders for sale are recommended to be considered not earlier than overcoming the critical Kijun-sen line with the targets of 1.1626 and 1.1614. In this case, the bears can again take the initiative in their hands and resume the downward trend.
In addition to the technical picture, one should also take into account the fundamental data and the time of their release.
Explanations to the illustration:
Ichimoku Indicator:
Tenkan-sen is a red line.
Kijun-sen is a blue line.
Senkou Span A is a light brown dotted line.
Senkou Span B - a light purple dotted line.
Chinkou Span is a green line.
Bollinger Bands Indicator:
3 yellow lines.
MACD indicator:
Red line and histogram with white bars in the indicator window.
InstaForex analytical reviews will make you fully aware of market trends! Being an InstaForex client, you are provided with a large number of free services for efficient trading.


