 Stay
Stay 
Trading Conditions
Products
Tools


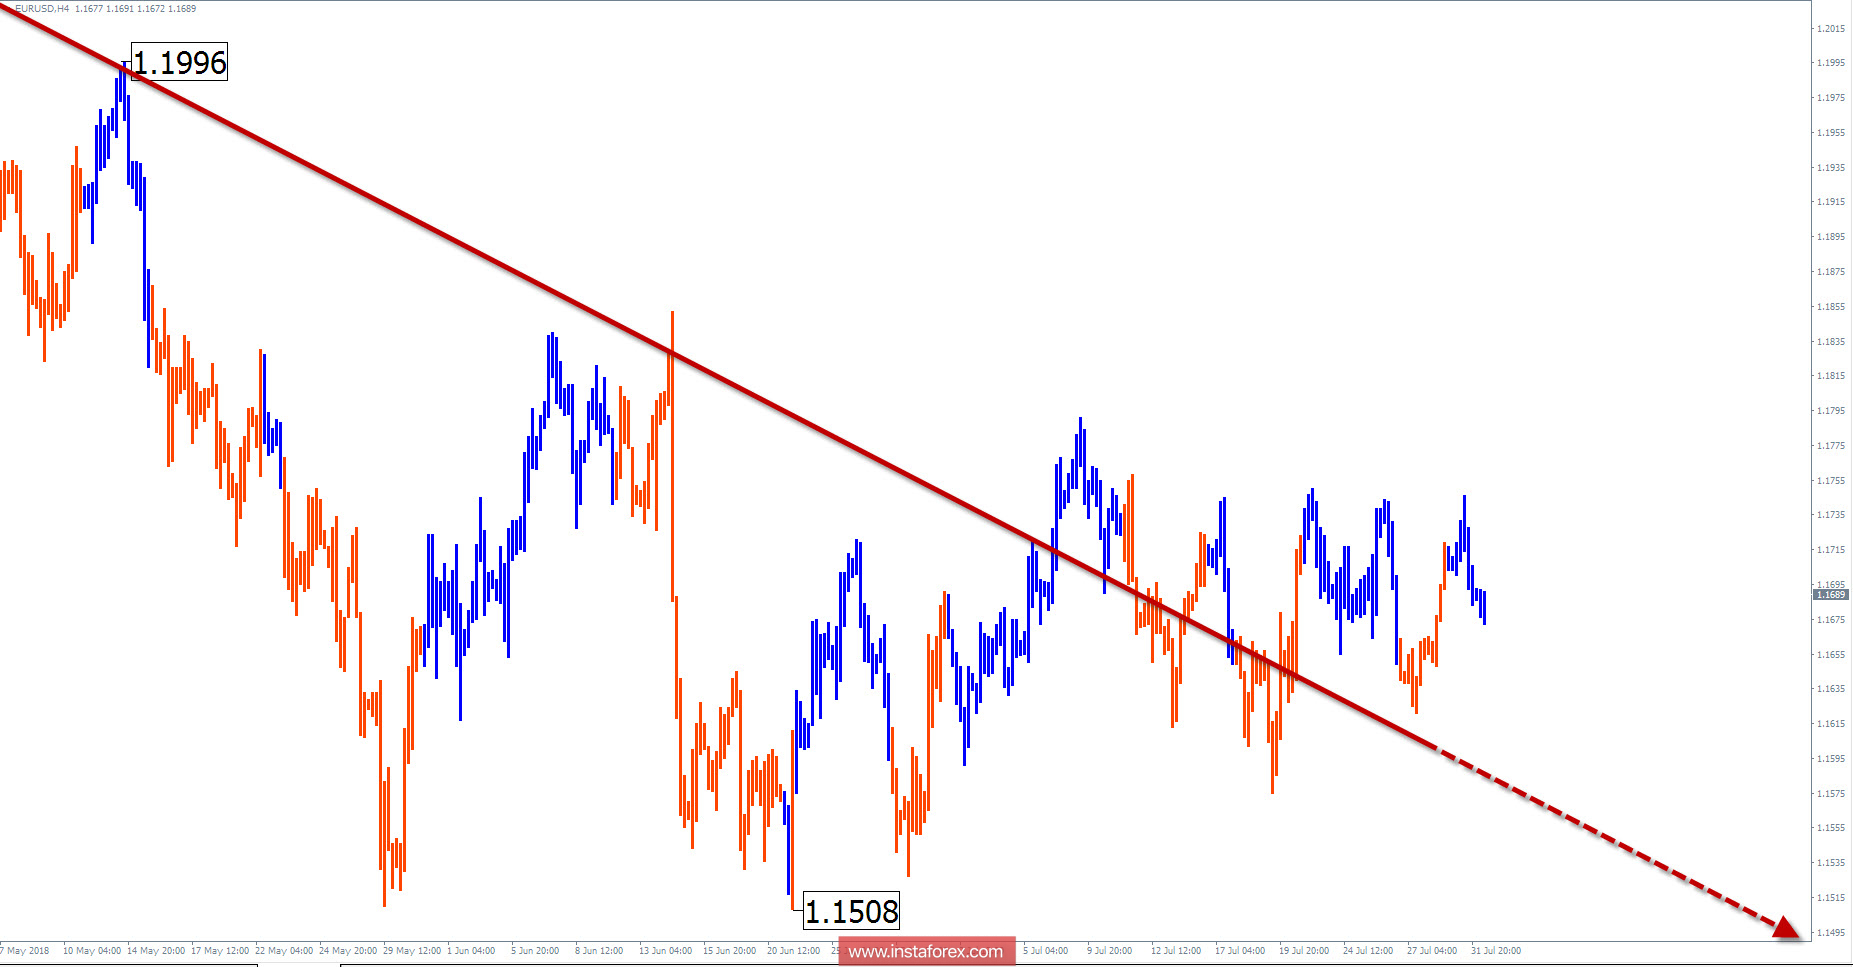
Wave picture of the chart H4:
The direction of the euro major downtrend is descending. The wave has been counting since January 25 and has reached the minimum possible level of elongation. Turn signals on the chart are not observed.
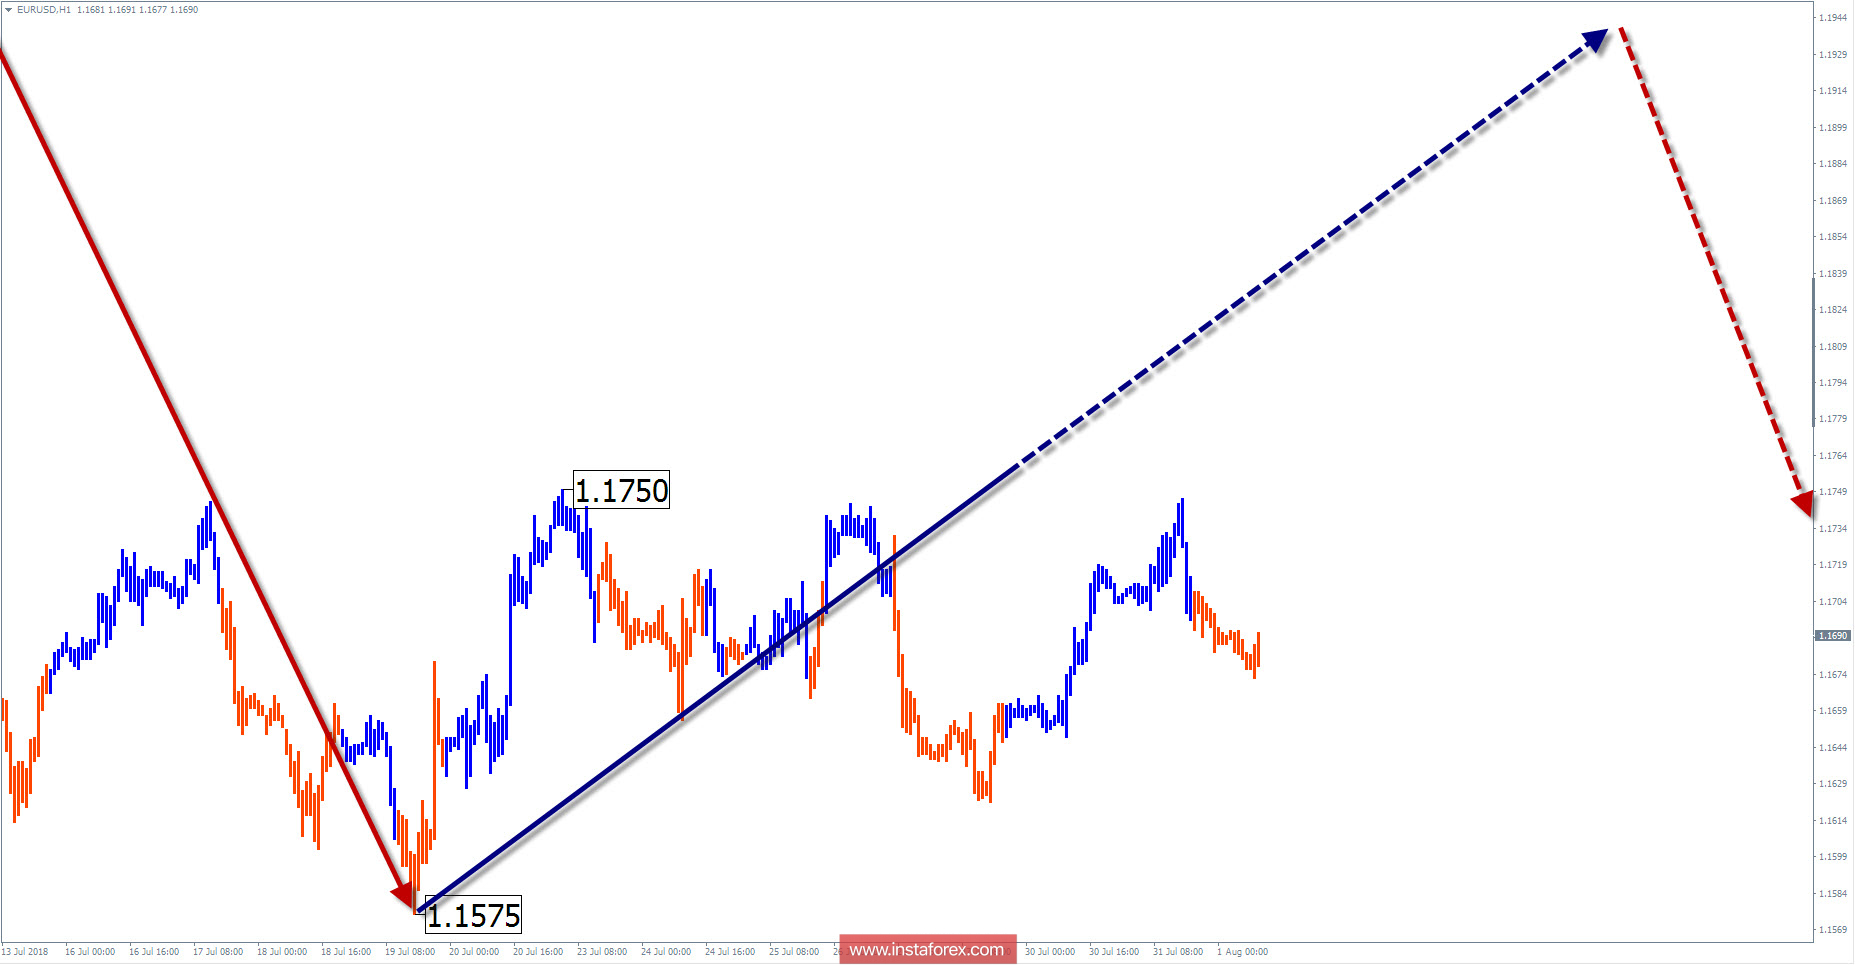
The wave pattern of the graph H1:
An upward wave from May 29 to the end is not formed. In recent weeks, the middle part (B) takes shape. The structure lacks the final part (C).
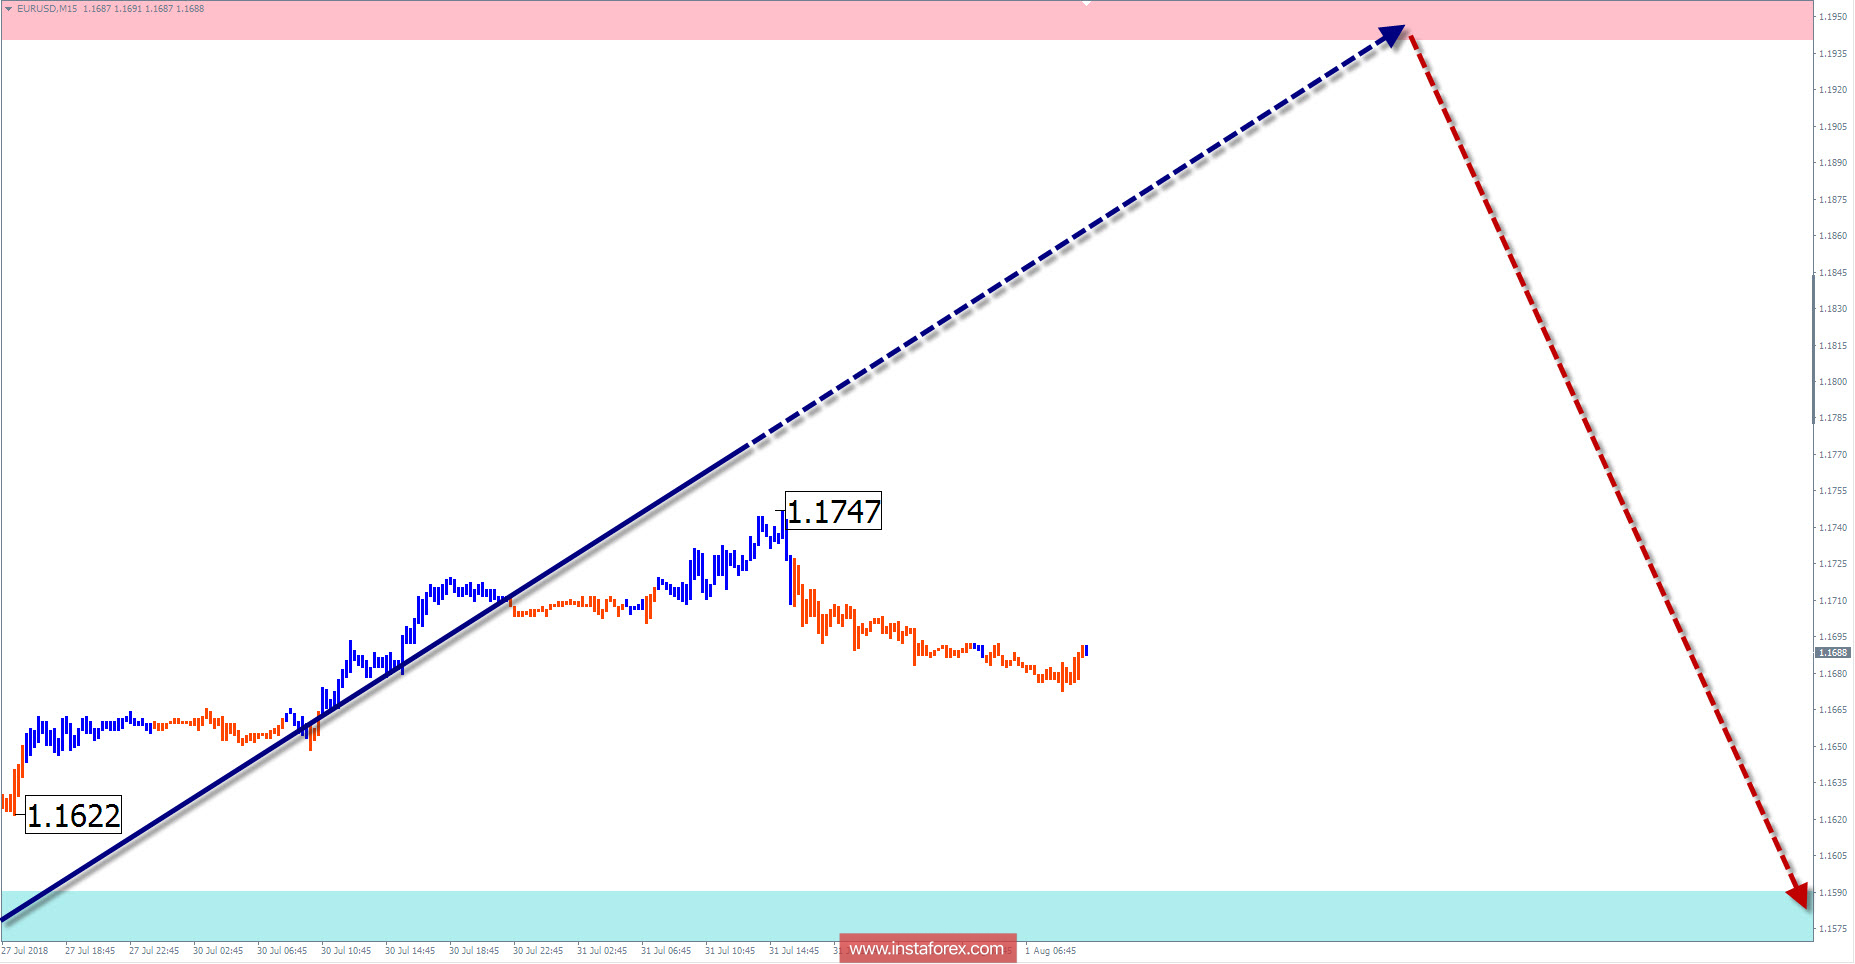
The wave pattern of the M15 chart:
Bear's wave of July 9 has a pronounced philt character. In a larger wave, this is a correction.
Recommended trading strategy:
Short-term purchases with a reduced lot can be recommended for small-scale trading on a schedule. The rest is better to wait until the correction is completed and to look for signals for sale.
Resistance zones:
- 1.1940 / 1.1990
Support zones:
- 1.1590 / 1.1540
Explanations to the figures: In a simplified wave analysis, waves consisting of 3 parts (A-B-C) are used. For analysis, 3 main TFs are used, on each one the last, incomplete wave is analyzed. Zones show the calculated areas with the greatest probability of a turn.
Arrows indicate the wave counting according to the technique used by the author. The solid background shows the generated structure, the dotted - the expected movements.
Attention: The wave algorithm does not take into account the duration of the tool movements in time. To conduct a trade transaction, you need confirmation signals from your trading systems!
InstaForex analytical reviews will make you fully aware of market trends! Being an InstaForex client, you are provided with a large number of free services for efficient trading.


