 Stay
Stay 
Trading Conditions
Products
Tools


EUR / USD pair
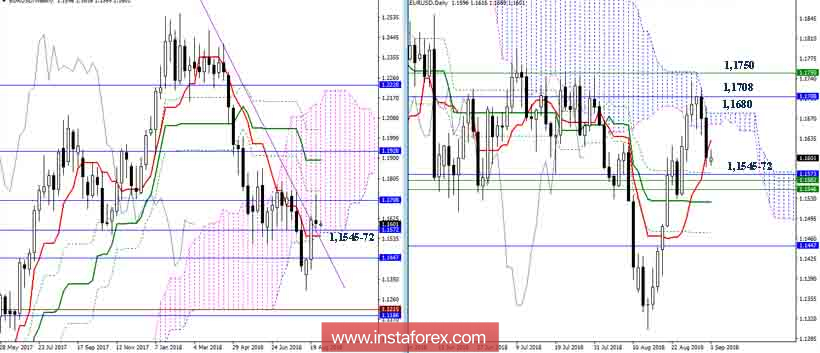
The pair returned to the weekly cloud, into a zone of uncertainty and the main counteraction. Overcoming the resistance in the area of 1.1680 area (daytime Senkou Span B) and 1.1750 (weekly Fibo Kijun) will allow formation of a new upward guidance points. In this case, the closest resistance at 1.1890-1.1930 (weekly Kijun + month Tenkan), then the interest of players on the rise will be directed in testing the upper boundary of the weekly cloud nd the fulfillment of the target on the breakdown of the day's cloud. Key support in the current situation is currently concentrated in the area of 1.1545-72 (the lower boundary of the weekly cloud + the weekly Tenkan + day cross). Fastening below can significantly delay the development of the situation, call into question the working capacity of the new day's golden cross.
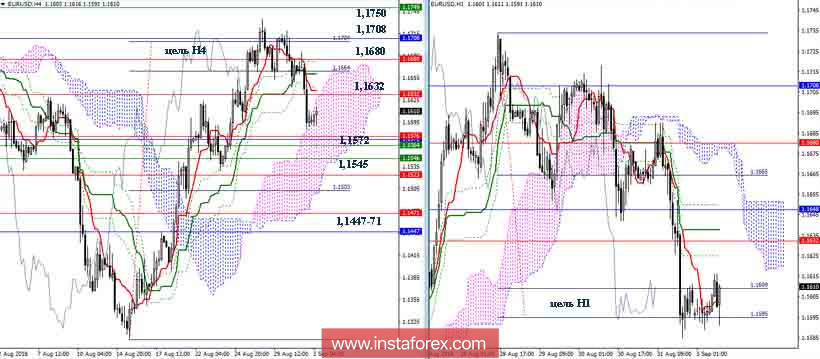
During the last movements, the levels of support and resistance had an increase from the goals of the breakdown of the clouds of lower timeframe. The Ichimoku indicator is currently on the lower timeframe, which has rebuilt and outlined the advantages for players to fall. If now the decline is not limited to the support of the H4 cloud and the target for the breakdown of the H1 cloud, as well as the key zone of higher time intervals (1.1545-72). The main task for the bears will be the breakdown of the H4 cloud and the emergence of new downward targets and benchmarks. If the forces of the existing support are sufficient to complete the reduction, the main priorities will be shifted towards players to rise. The recovery of bullish positions and advantages lies today through 1.1632 - 1.1680 - 1.1708 - 1.1750.
Indicator parameters:
all time intervals 9 - 26 - 52
Color of indicator lines:
Tenkan (short-term trend) - red,
Kijun (medium-term trend) - green,
Fibo Kijun is a green dotted line,
Chikou is gray,
clouds: Senkou Span B (SSB, long-term trend) - blue,
Senkou Span A (SSA) - pink.
Color of additional lines:
support and resistance MN - blue, W1 - green, D1 - red, H4 - pink, H1 - gray,
horizontal levels (not Ichimoku) - brown,
trend lines - purple.
InstaForex analytical reviews will make you fully aware of market trends! Being an InstaForex client, you are provided with a large number of free services for efficient trading.


