 Stay
Stay 
Trading Conditions
Products
Tools


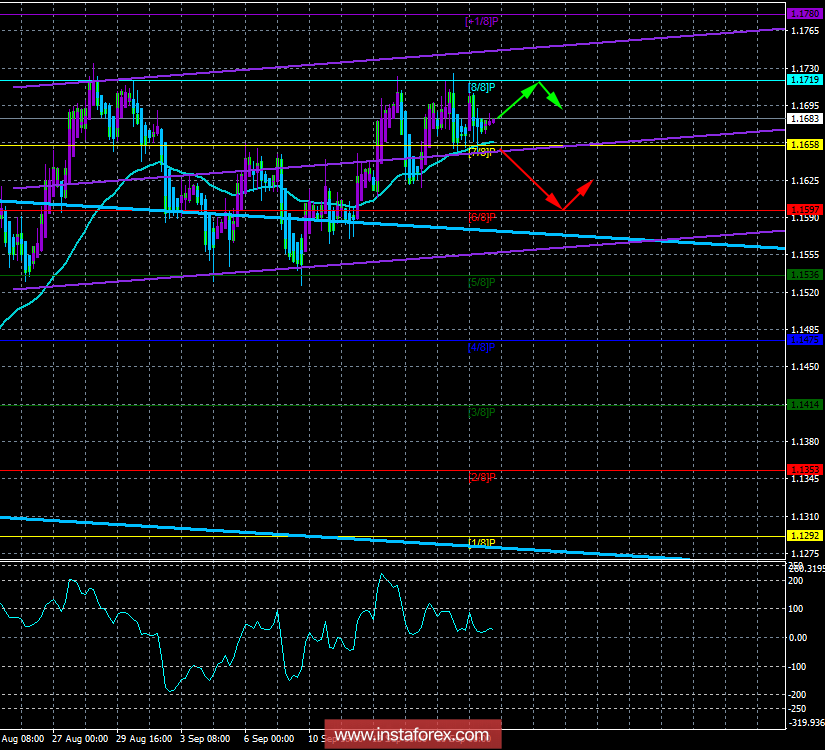
4-hour timeframe
Technical data:
The senior channel of linear regression: direction - down.
The younger channel of linear regression: the direction is up.
The moving average (20; flattened) is up.
СCI: 25.3604
The currency pair EUR / USD on September 20 is still traded between the level of Murray "8/8" - 1.1719 and the moving average line. The question now in technical terms is only one. What will happen in the end: overcoming the level of 1.1720 or moving? Chances are 50/50. From the fundamental point of view, there is really nothing to note today. There are no important macroeconomic publications for today. Secondary reports on the number of applications for unemployment benefits in the US and the level of consumer confidence in the EU, most likely, will not attract the attention of traders. Also in recent days, there have been no new reports from Donald Trump. Although it should be noted here that traders stopped to react to new trade duties in one direction or another. In general, the market lull and will require a powerful driver, so that the pair managed to escape from a sufficient narrow side channel. Thus, it is recommended to wait for an exit from this side channel, which will show the trend on the instrument for the next few days.
Nearest support levels:
S1 = 1.1658
S2 - 1,1597
S3 - 1.1536
Nearest resistance levels:
R1 = 1.1719
R2 = 1,1780
R3 = 1.1841
Trading recommendations:
The currency pair EUR / USD dropped to the Moving and rebounded from it. Thus, now it is recommended to consider new routes with a target of 1.1719, as our Heikin Ashi indicator has colored the last bars in purple.
It is recommended to open short positions if traders manage to gain a foothold below the moving average line. In this case, Murray's level "6/8" - 1.1597 will be the target for the downward trade.
In addition to the technical picture, one should also take into account the fundamental data and the time of their release.
Explanations for illustrations:
The upper channel of linear regression is the blue lines of unidirectional motion.
The lowest linear regression channel is the violet lines of unidirectional motion.
CCI - the blue line in the indicator window.
Moving average (20; smoothed) - the blue line on the price chart.
Levels of Murray - multi-colored horizontal stripes.
Heikin Ashi is an indicator that color bars in blue or purple.
InstaForex analytical reviews will make you fully aware of market trends! Being an InstaForex client, you are provided with a large number of free services for efficient trading.


