 Stay
Stay 
Trading Conditions
Products
Tools


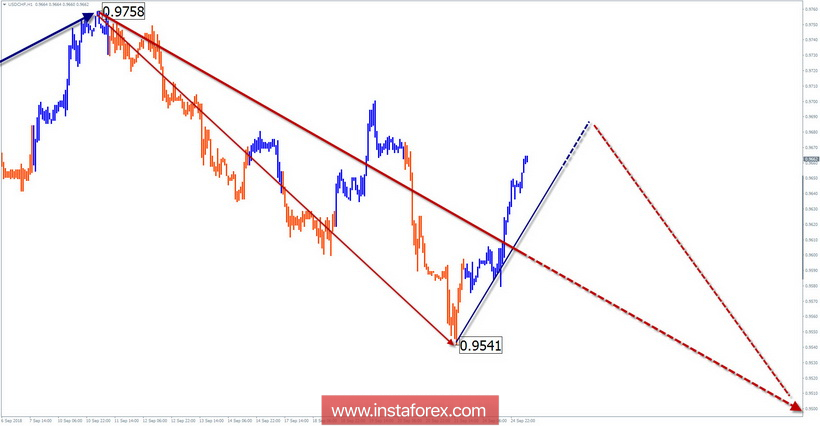
The wave pattern of the H4 graph:
The direction of the short-term trend of the pair is set by the bearish wave of May 9. In a larger wave, it corrects the first section of the trend.
The wave pattern of the H1 graph:
The wave of July 17 forms the final part (C) in a 4-hour wave construction. The price has reached the upper limit of a wide support zone of large scale.
The wave pattern of the M15 chart:
The descending section, which began on September 11, is formed along the trend direction of the higher timeframe. In recent days there has been an upward rollback. Turn signals are not generated.
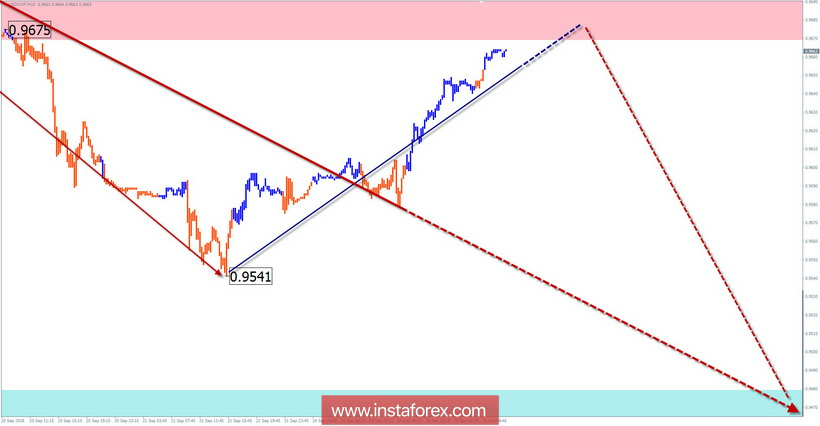
Recommended trading strategy:
A small potential for further decline makes sales justified within the framework of intraday trading. It is recommended to wait for the completion of the entire decline and to look for turn signals in purchasing the instrument.
Resistance zones:
- 0.9670 / 0.9720
Support zones:
- 0.9480 / 0.9430
Explanations to the figures:
A simplified wave analysis uses a simple waveform, in the form of a 3-part zigzag (ABC). The last incomplete wave for every timeframe is analyzed. Zones show the calculated areas with the greatest probability of a turn.
Arrows indicate the counting of wave according to the technique used by the author. The solid background shows the generated structure and the dotted exhibits the expected wave motion.
Attention: The wave algorithm does not take into account the duration of the tool movements in time. To conduct a trade transaction, you need to confirm the signals used by your trading systems.
InstaForex analytical reviews will make you fully aware of market trends! Being an InstaForex client, you are provided with a large number of free services for efficient trading.


