 Stay
Stay 
Trading Conditions
Products
Tools


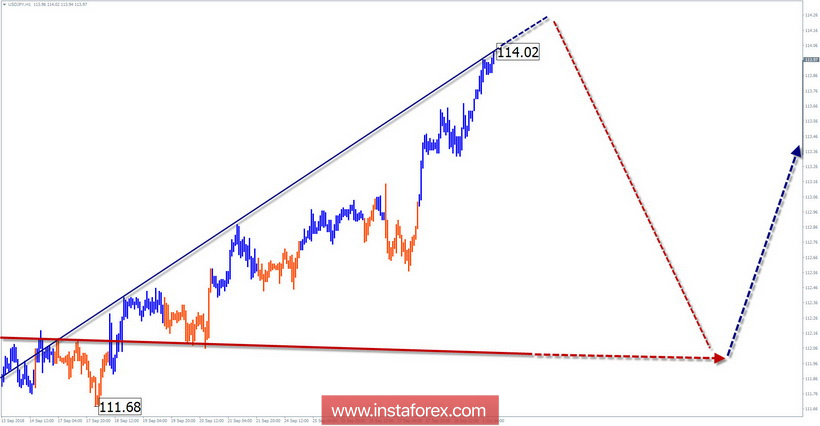
The wave pattern of the H4 graph:
Since the end of March, a rising wave is formed. In the daytime wave, the plot forms the final part (C) of the ascending zigzag which has a pronounced pulse form.
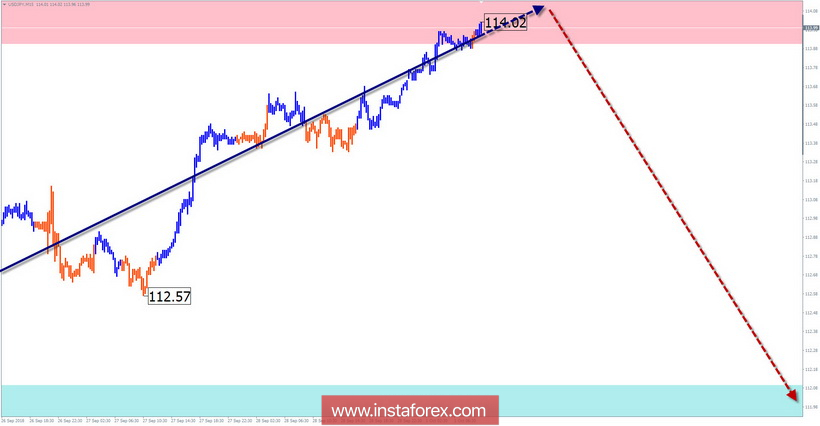
The wave pattern of the H1 graph:
The July 19th wave formed in the larger model has the wrong kind of correction. The structure lacks the final part (C). Given the size of the lengthening of the middle part (B), the wave will end at the lowest possible levels.
The wave pattern of the M15 chart:
The bullish wave of August 21 reached the lower boundary of a large resistance zone.
Recommended trading strategy:
In the coming days, volatility is expected to increase with a price pullback. Yet, there may be risks because of the small potential for lowering sales. In the area of the calculation zone, it is recommended to monitor the emerging signals for entering long positions.
Resistance zones:
- 113.90 / 114.40
Support zones:
- 112.10 / 111.60
Explanations to the figures:
A simplified wave analysis uses a simple waveform, in the form of a 3-part zigzag (ABC). The last incomplete wave for every timeframe is analyzed. Zones show the calculated areas with the greatest probability of a turn.
Arrows indicate the counting of wave according to the technique used by the author. The solid background shows the generated structure and the dotted exhibits the expected wave motion.
Attention: The wave algorithm does not take into account the duration of the tool movements in time. To conduct a trade transaction, you need to confirm the signals used by your trading systems.
InstaForex analytical reviews will make you fully aware of market trends! Being an InstaForex client, you are provided with a large number of free services for efficient trading.

