 Stay
Stay 
Trading Conditions
Products
Tools


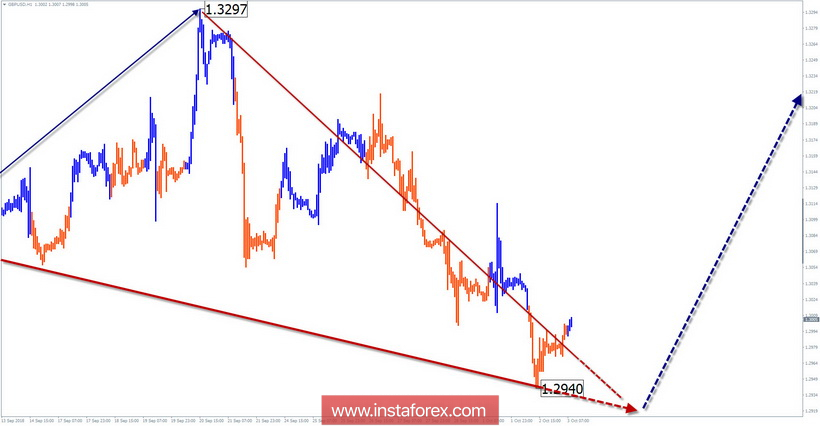
Wave pattern graphics H4:
The bearish segment of the pound major chart of April 14 completes the downward correction of the daily scale. The price reached the upper limit of the target zone.
Wave pattern graphics H1:
The rising wave of August 15 has a reversal potential. In recent weeks, the formation of the correction (B) is completed within the model.
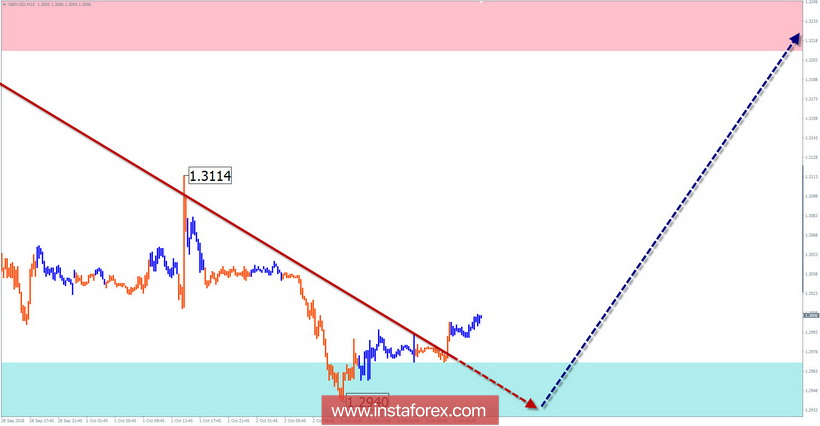
Wave pattern graphics M15:
The wave of September 20 completes the hidden downward wave of the hour scale. The price has reached the estimated zone of probable completion. U-turn signals are not yet observed.
Recommended trading strategy:
In the coming days, favorable conditions will be created on the chart of the instrument for entering long transactions. Purchasing may be relevant over the coming months.
Resistance zones:
- 1.3210 / 1.3260
Support zones:
- 1.2970 / 1.2920
Explanations of the figures: The simplified wave analysis uses waves consisting of 3 parts (A – B – C). For the analysis, 3 main TFs are used, on each, the last, incomplete wave is analyzed. Zones show calculated areas with the highest probability of reversal.
The arrows indicate the wave marking by the method used by the author. The solid background shows the formed structure, the dotted - the expected movement.
Note: The wave algorithm does not take into account the duration of tool movements over time. To conduct a trade transaction, you need confirmation signals from the trading systems you use!
InstaForex analytical reviews will make you fully aware of market trends! Being an InstaForex client, you are provided with a large number of free services for efficient trading.


