 Stay
Stay 
Trading Conditions
Products
Tools


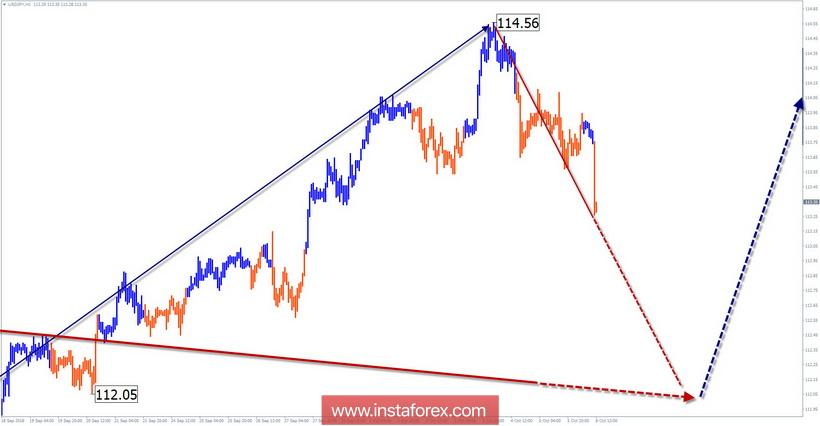
Wave pattern on the H4 chart:
The rising wave dominates with a starting point on March 26. A rising high wave level indicates an imminent transition to a larger scale of motion.
Wave pattern on the H1 chart:
From the middle of July, a descending wave in a wrong structure is forming, which will then become a correction.
Wave pattern on the M15 chart:
A bearish wave forms from the resistance zone on October 4. In the hour-wave model, the plot will become the final part (C).
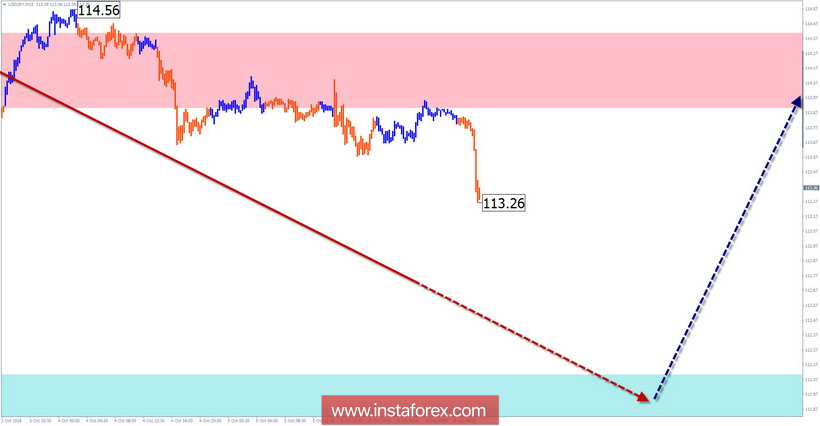
Recommended trading strategy:
On a small scale, technical support for intraday can make sales. A lot is more reasonable to reduce. For the purchase of the pair.
Resistance zones:
- 113.90 / 114.40
Support areas:
- 112.10 / 111.60
Explanations to the figures:
The simplified wave analysis uses waves consisting of 3 parts (A – B – C). For the analysis, three main TFs are used. On every last part, the incomplete wave is analyzed. Zones show calculated areas with the highest probability of reversal.
The arrows indicate the wave marking by the method used by the author. The solid background shows the formed structure while the dotted shows the expected movement.
Note: The wave algorithm does not take into account the duration of tool movements over time. To conduct a trade transaction, you need confirmation signals from the trading systems you use!
InstaForex analytical reviews will make you fully aware of market trends! Being an InstaForex client, you are provided with a large number of free services for efficient trading.


