 Stay
Stay 
Trading Conditions
Products
Tools


Wave pattern graphics H 4:
In the downward wave of the daytime scale dominating from the beginning of the year, the last wave design H4 from the middle of August forms an upward correction.
Wave pattern graphics H1:
From September 24, a bearish wave is formed. Its structure at the time of analysis looks complete. Moreover, the minimum goals have been achieved. The plot has become a correction (B).

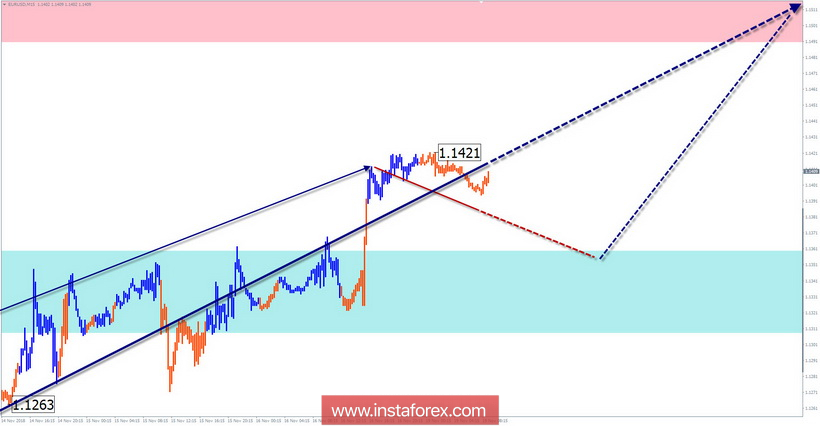
Wave pattern graphics M15:
The high potential of the rising wave that began on November 12 indicates a change in the inter-day trend of the instrument. Over time, the movement will move to a larger scale. In the coming days there is a short-term pullback down.
Recommended trading strategy:
For supporters of trade on a large scale , it is better to refrain from trading until the completion of the entire current wave. For supporters of intersessional trade, there is an opportunity to make short-term purchases of the pair.
Resistance zones:
- 1.1490 / 1.1540
Support areas:
- 1.1360 / 1.1310
Explanations to the figures: The simplified wave analysis uses waves consisting of 3 parts (A - B - C) . For the analysis, 3 main TFs are used. On each the last, incomplete wave is analyzed. Zones show calculated areas with the highest probability of reversal.
The arrows indicate the wave marking by the method used by the author. The solid background shows the formed structure, the dotted - the expected movement.
Note: The wave algorithm does not take into account the duration of tool movements over time. To conduct a trade transaction, you need confirmation signals from the trading systems you use.
InstaForex analytical reviews will make you fully aware of market trends! Being an InstaForex client, you are provided with a large number of free services for efficient trading.


