 Stay
Stay 
Trading Conditions
Products
Tools

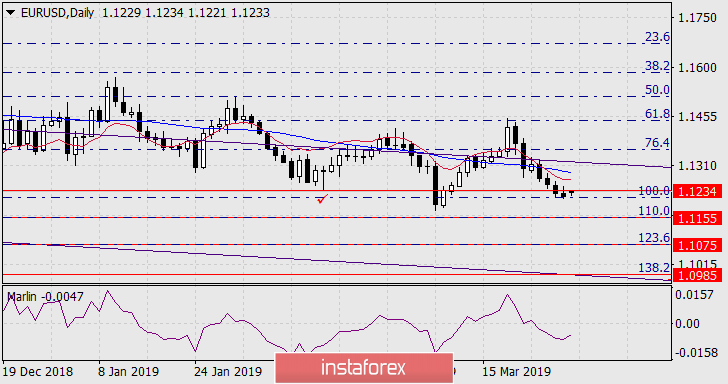
EUR/USD
Last Friday, the euro tried to get above the control technical level of 1.1234, but the bears stopped these attempts, the day closed with a black candle and thus the price consolidated below this level, which created another additional factor for the euro's further decline to Fibonacci lines: 1.1155 - 110.0%, 1.1075 - 123.6%, 1.0985 - 138.2%. The basic branch of the Fibonacci grid is taken at extremes on September 24 and November 12, 2018.
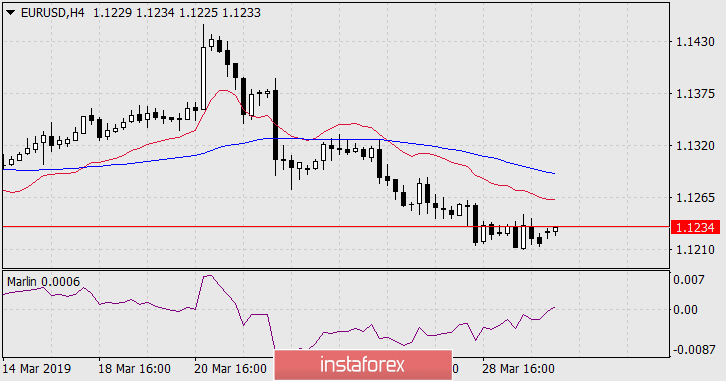
On the four-hour chart, the signal line of the Marlin oscillator enters the growth zone, which warns about the possibility of a false exit of the price over the control level of 1.1234, but in general, this does not change the situation.
InstaForex analytical reviews will make you fully aware of market trends! Being an InstaForex client, you are provided with a large number of free services for efficient trading.


