 Stay
Stay 
Trading Conditions
Products
Tools


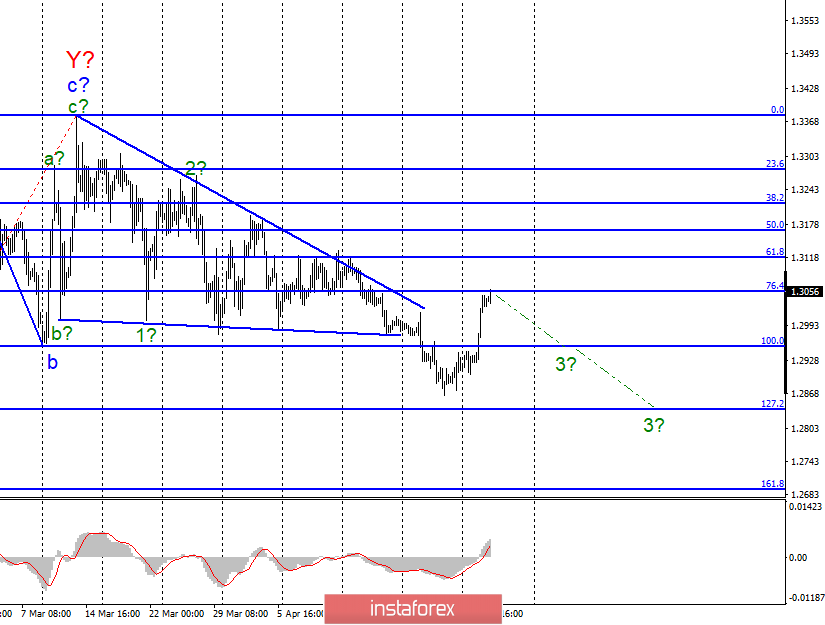
Wave counting analysis:
On April 30, the GBP/USD pair gained about 100 base points and now there are doubts about the readiness of the pair to continue building the downward trend. Wave marking is not quite the standard form. The latest news regarding Brexit can be interpreted in different ways. They relate to the negotiations of Theresa May with the Labor Party on the agreement on Brexit. There are no unambiguously positive reports, but the market may see some positive moments in these negotiations. In theory, they increase the likelihood of accepting an agreement on the next ballot in parliament. Nevertheless, I still allow the resumption of the construction of the downward trend. An unsuccessful attempt to break the 76.4% Fibonacci mark or turn the MACD down will be signal that will make you think about the readiness of the instrument for a new decline.
Purchase goals:
1.3118 - 61.8% of Fibonacci
1.3168 - 50.0% of Fibonacci
Sales targets:
1.2954 - 100.0% of Fibonacci
1.2838 - 127.2% of Fibonacci
General conclusions and trading recommendations:
The wave pattern still involves building a downward trend, especially after the break of the lower line of the triangle. Now I recommend waiting for the completion of the correction wave and selling the pair with targets located near the calculated levels of 1.2839 and 1.2693, which corresponds to 127.2% and 161.8% Fibonacci. The signals can be the readings of the MACD indicator or an unsuccessful attempt to break one of the Fibonacci levels, the nearest one is 76.4%.
InstaForex analytical reviews will make you fully aware of market trends! Being an InstaForex client, you are provided with a large number of free services for efficient trading.


