 Stay
Stay 
Trading Conditions
Products
Tools


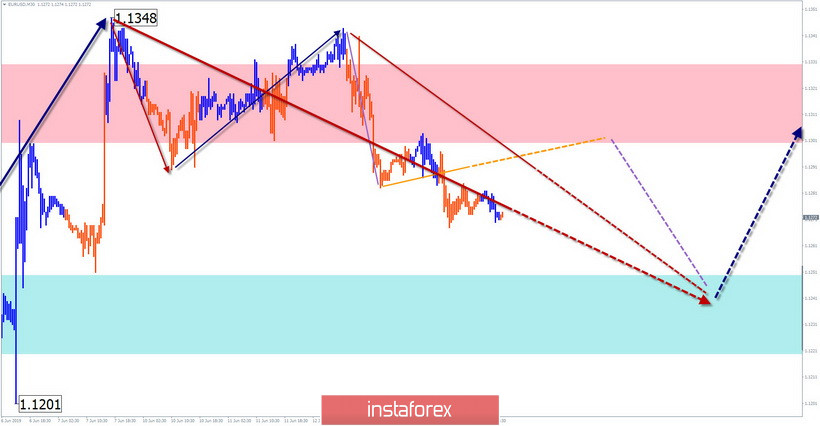
EUR/USD
Within the framework of the short-term trend dominating the bullish wave since May 23, a correction zigzag is formed on the euro chart throughout the current week. Quotes have reached the level of the minimum elongation. The proportions of the entire parts are met, but the signals for immediate reversal are not yet observed.
Forecast:
At the next trading sessions, an overall flat mood of price movement is expected, within the price corridor between the counter-zones. In the morning, the upward vector of oscillations is more likely. A return to the active growth phase is more likely next week.
Recommendations:
In the market of the pair today, only short-term purchases and sales from the boundaries of the price corridor are possible, within the framework of the described algorithm. The lot is better to reduce to a minimum. The most reasonable solution would be to refrain from trading and wait until the end of the entire current wave, with the search for an entry point to a long position at its end.
Resistance zones:
- 1.1300/1.1330
Support zones:
- 1.1250/1.1220
USD/JPY
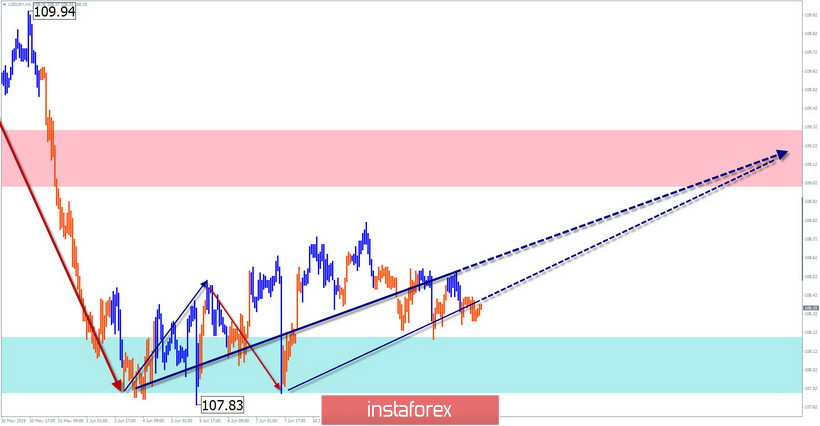
The current rising wave of the Japanese yen since June 3 has a rather different wave level, which allows to classify it as a correction of the previous bearish section from May 21. The minimum preliminary target of the entire wave is located in the area of the 110th price figure. The wave structure lacks the final part (C).
Forecast:
Today, the downward movement of the pair is expected to continue until the end of the decline in the support zone. The turnaround and beginning of the active phase of the lift can begin as early as the next day. The change of the pair's rate can be tied to the time of the release of the important news block.
Recommendations:
Sales today are not very promising. It is recommended to track the signals of your vehicle to search for signals of entry into long positions in this instrument.
Resistance zones:
- 108.80/109.10
Support zones:
- 108.20/107.90
GBP/JPY
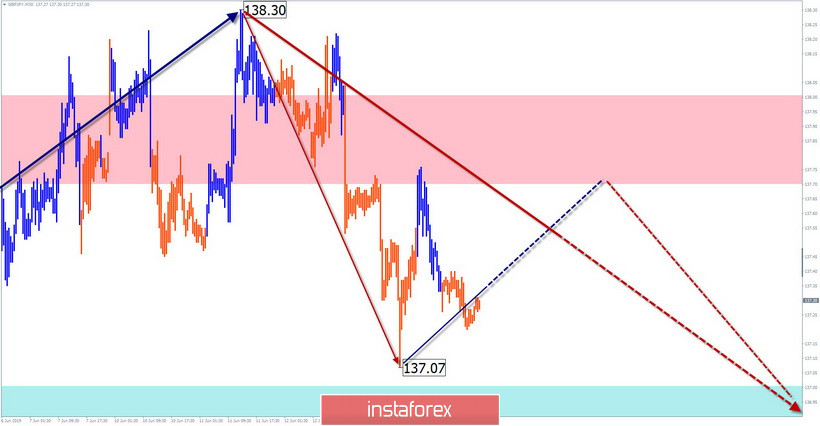
Since May 31, a rising wave has been forming on the cross chart. Its current potential puts it in place of the correction of the last segment of the previous bearish trend. The wave has reached the minimum estimated size. From June 11, a downward wave is developing, which can be both the beginning of a new wave of the main trend and an intermediate link in the current wave of correction.
Forecast:
In the first half of the day today, an upward mood of movement is more likely. The magnitude of rise is limited by the resistance area. Towards the end of the day, the change in the rate and the beginning of a decline increases. Support levels will limit the size of the daily volatile pair.
Recommendations:
Buy a pair today followed with caution, due to the likelihood of sharp reversals down. In the area of the resistance zone, it is recommended to monitor the signals of the instrument sale.
Resistance zones:
- 137.70/138.00
Support zones:
- 137.00/136.70
Explanations to the figures: Waves in the simplified wave analysis consist of 3 parts (A – B – C). The last unfinished wave is analyzed. Zones show areas with the highest probability of reversal. The arrows indicate the wave marking according to the method used by the author, the solid background is the formed structure, the dotted ones are the expected movements.
Note: The wave algorithm does not take into account the duration of tool movements over time.
InstaForex analytical reviews will make you fully aware of market trends! Being an InstaForex client, you are provided with a large number of free services for efficient trading.


