 Stay
Stay 
Trading Conditions
Products
Tools


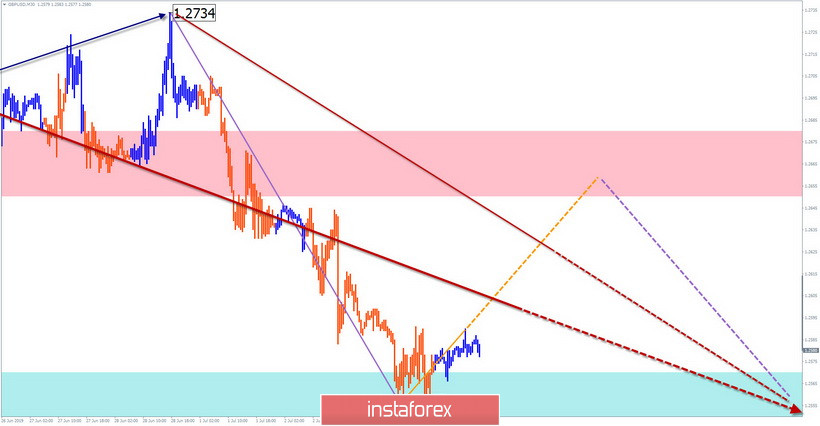
GBP/USD
The chart of the British currency since March is dominated by a bearish trend. Since June 18, a bullish wave has formed. The wave level of the downward wave, which began on June 25, does not exceed the size of the correction of the previous rise, but is close to it. The price is in the area of a potential reversal of a large TF.
Forecast:
Today is expected to flat, with an upward vector. The current wave with equal probability can remain a correction (B) of the previous upward section or become the first part of the new downward wave. The scope of the upcoming price rise will clarify the further scenario of the movement.
Recommendations:
Sales of the pound today can be relevant only by the end of the day. Supporters of intra-session trading can use short-term purchases with a reduced lot, the rest is wiser to refrain from trading. In the area of the calculated resistance, it is recommended to start tracking the reversal signals of your TS to find the entry point into a short trade.
Resistance zone:
- 1.2650/1.2680
Support zone:
- 1.2570/1.2540
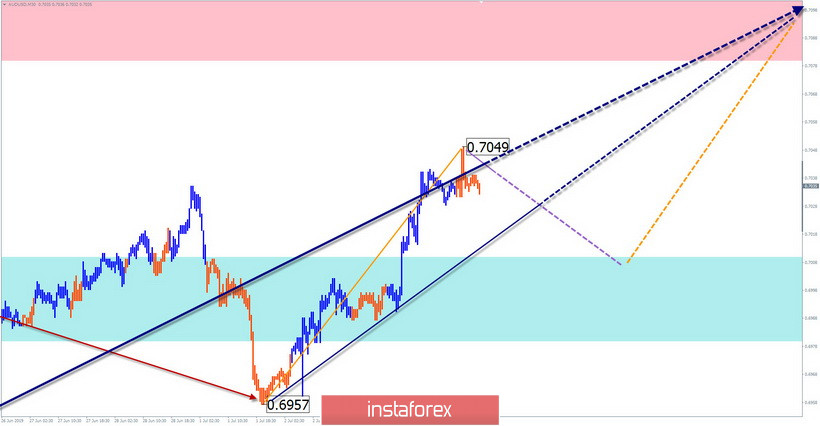
AUD/USD
Beginning on May 21, the rising wave of "Aussie" entered the final phase of the movement. Within the last segment, after the end of the counter correction, the final section started on July 1. The calculated resistance is at the lower edge of the target zone.
Forecast:
In the first half of the day, there is a high probability of a downward pullback of the pair. The scope of the reduction will limit the support zone. By the end of the day, returning to the main motion vector is expected. It is possible to increase volatility.
Recommendations:
Sales of the pair today can only be used in short-term transactions. In the area of the support zone, after the appearance of reversal signals, it is recommended to look for the entrance to long positions.
Resistance zone:
- 0.7080/0.7110
Support zone:
- 0.7010/0.6980
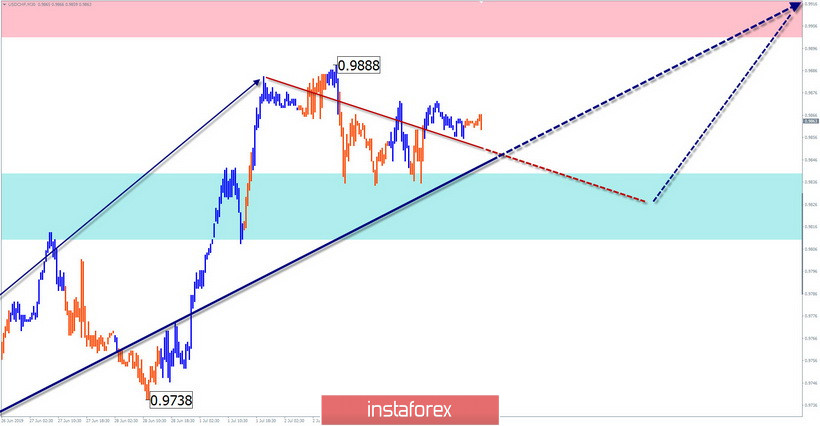
USD/CHF
The vector of the main movement of the Swiss franc in the short term from June 25 is directed upwards. The wave level of the current wave indicates its reversal potential. In the structure of the wave from July 1, a downward correction is developing, which has not yet been completed.
Forecast:
Today, the general flat mood is expected. At the next session, there is a high probability of a repeated decline in the price in the support area. By the end of the day, the chance of a change in rate and its rise to the potential reversal zone increases.
Recommendations:
Trading in the flat today can put interest only for supporters of "scalping". When selling, the lot size should be reduced. Purchases from the support area may be relevant for several days.
Resistance zone:
- 0.9900/0.9930
Support zone:
- 0.9840/0.9810
Explanations to the figures: Waves in the simplified wave analysis consist of 3 parts (A-B-C). The last unfinished wave is analyzed. Zones show areas with the highest probability of reversal. The arrows indicate the wave marking according to the method used by the author, the solid background is the formed structure, the dotted ones are the expected movements.
Note: The wave algorithm does not take into account the duration of tool movements over time.
InstaForex analytical reviews will make you fully aware of market trends! Being an InstaForex client, you are provided with a large number of free services for efficient trading.


