 Stay
Stay 
Trading Conditions
Products
Tools


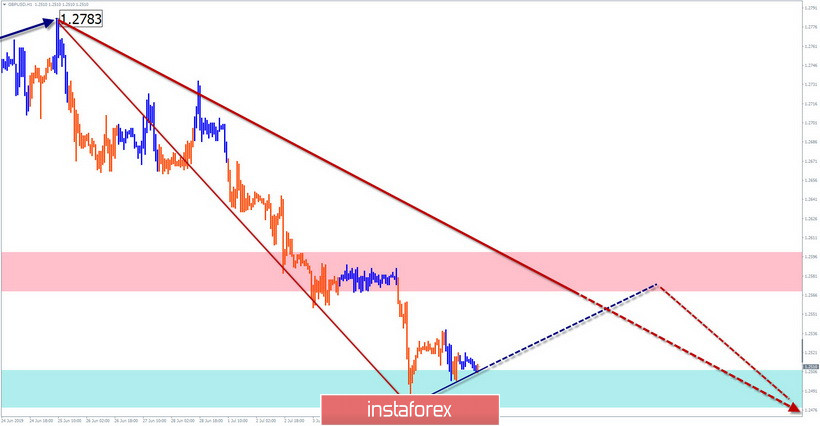
GBP/USD
On the chart of the British pound, the main trend of the pair is down. The wave level of the downward wave of June 25 exceeded the size of the correction of the previous wave. Accordingly, a new wave started in the direction of the dominant course. In its framework, in the last 2 days, an upward rollback develops.
Forecast:
Today, the completion of the preparatory part of the movement in the flat and the beginning of the price rise is expected. Increased activity is more likely in the afternoon. The resistance zone shows the maximum expected range of daily course.
Recommendations:
Selling the British pound today is risky. Supporters of intraday trading can make short-term purchases. For longer trades, it is recommended to refrain from entering the market of the pair until the end of the rollback up and look for sell signals at its end.
Resistance zone:
- 1.2570/1.2600
Support zone:
- 1.2510/1.2480
USD/JPY
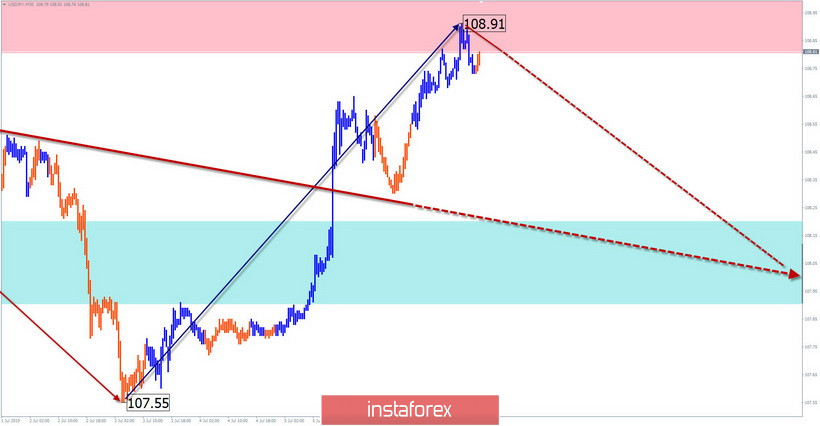
The direction of the short-term trend of the Japanese yen since the end of April is set by a bearish wave. In its framework, in the third decade of June, a counter correction was formed. The wave level of the downward zigzag, which began on July 1, exceeds the level of the internal rollback. This allows us to classify this movement to the beginning of a new bearish wave. The price is within a strong resistance zone.
Forecast:
Today, the general flat mood of the exchange rate fluctuations is likely. In the morning, you can expect a downward vector of price movement. By the end of the day, the probability of a reversal and rollback of the price up increases.
Recommendations:
The pair's purchases at the next sessions are unpromising. In the area of the resistance zone, it is recommended to track reversal signals to enter short positions on the instrument.
Resistance zone:
- 108.80/109.10
Support zone:
- 108.20/107.90
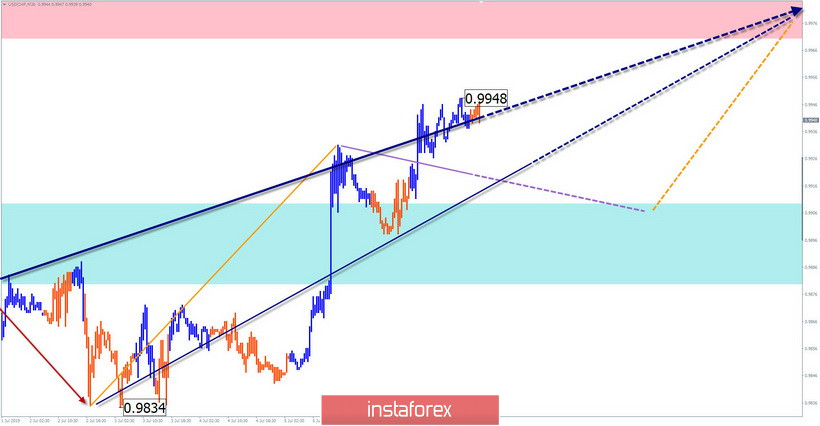
USD/CHF
The direction of short-term movements of the Swiss franc dictates the algorithm of the emerging bullish wave of June 25. In its structure, a counter-correction wave of the small scale was formed, in which the final part is missing.
Forecast:
During the next day, it is expected to complete the intermediate correction and return to the main vector of movement. Most likely, the plot shows the estimated completion support. Change of rate can be expected at the end of the day or tomorrow. The resistance zone is intermediate, it shows the upper limit of the expected daily course of the pair.
Recommendations:
When selling the pair today, it is necessary to reduce the lot size and fix the transaction at the first signs of a reversal. The best tactic is to refrain from trading during the rollback and look for long position entry signals at the end of the rollback
Resistance zone:
- 0.9970/1.0000
Support zone:
- 0.9910/0.9880
Explanations to the figures: Waves in the simplified wave analysis consist of 3 parts (A-B-C). The last unfinished wave is analyzed. Zones show areas with the highest probability of reversal. The arrows indicate the wave marking according to the method used by the author, the solid background is the formed structure, the dotted ones are the expected movements.
Note: The wave algorithm does not take into account the duration of tool movements over time.
InstaForex analytical reviews will make you fully aware of market trends! Being an InstaForex client, you are provided with a large number of free services for efficient trading.

