 Stay
Stay 
Trading Conditions
Products
Tools


AUD / USD
After yesterday's rate cut by the Reserve Bank of New Zealand immediately by 0.50% - from 1.50% to 1.00%, along with the "New Zealander", the Australian dollar went down as well. Its movement directed to more than 80 points in the morning, but the trading day was closed by the "Australian" 2 points below. As a result, the price only pierced two support of two price channels at once - red and blue, and today, in the Asian session, it fluctuates in the range of Monday-Tuesday.
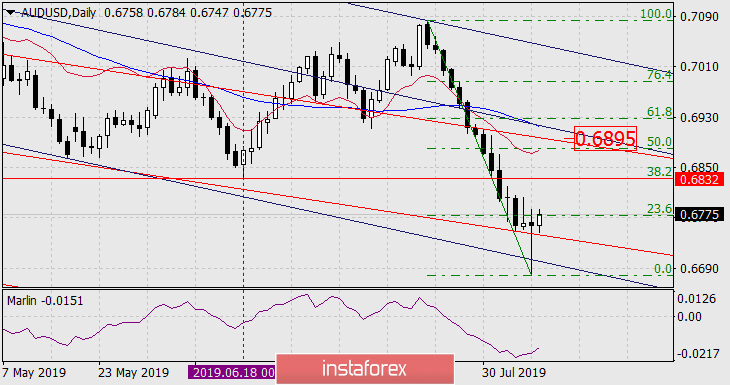
On the daily chart, the signal line of the Marlin oscillator is turning up from the oversold zone, which after an unsuccessful break down can be a sign of a beginning correction. However, the big question is the depth of a possible correction. First of all, we note that a correction of 23.6% of the 14-day decline has already taken place. The desire of the market to increase it gives us a guideline of 38.2% Fibonacci level at the price of 0.6832, which exactly corresponds to the low of June 18th. Consolidating above the level will allow the price to rise to the area of 50.0% Fibonacci, where the lines of price channels and indicator lines of resistance accumulate, and for the price, it seems that it will be insurmountable resistance.
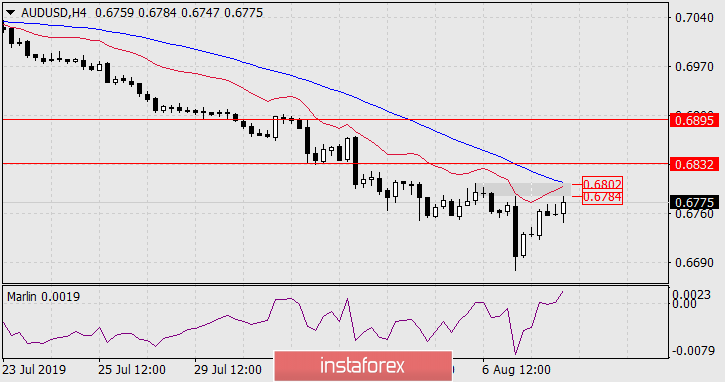
On a four-hour chart, the price is below the lines of balance (indicator red) and MACD (indicator blue), the Marlin oscillator in the territory of the growing trend. Here, the resistance is in the range 0.6784-0.6802, in which the MACD line hurries to infiltrate. Whether the price can overcome this near and strong resistance is unclear. Thus, we should continue to wait for the development of events.
InstaForex analytical reviews will make you fully aware of market trends! Being an InstaForex client, you are provided with a large number of free services for efficient trading.

