 Stay
Stay 
Trading Conditions
Products
Tools


Trend analysis.
This week, the price will move up with the first target of 1.2363 – a pullback level of 14.6% (yellow dotted line).
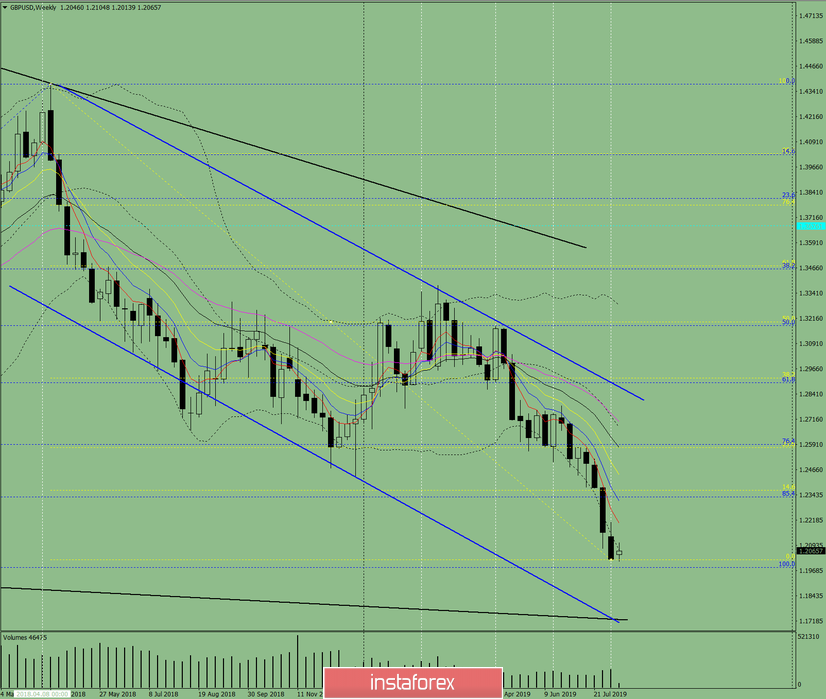
Fig. 1 (weekly chart).
Complex analysis:
- Indicator analysis – down;
- Fibonacci levels – up;
- Volumes – up;
- Candle analysis – up;
- Trend analysis – down;
- Bollinger Bands – up;
- Monthly schedule – down.
The conclusion from the complex analysis is the upward movement.
The overall result of the calculation of the GBP/USD currency pair candle on the weekly chart: the price in the week is likely to have an upward trend with the absence of the first lower shadow of the weekly white candle (Monday – up) and the presence of the second upper shadow (Friday – down).
This week, the price will move up with the first target of 1.2363 – a pullback level of 14.6% (yellow dotted line).
InstaForex analytical reviews will make you fully aware of market trends! Being an InstaForex client, you are provided with a large number of free services for efficient trading.

