 Stay
Stay 
Trading Conditions
Products
Tools


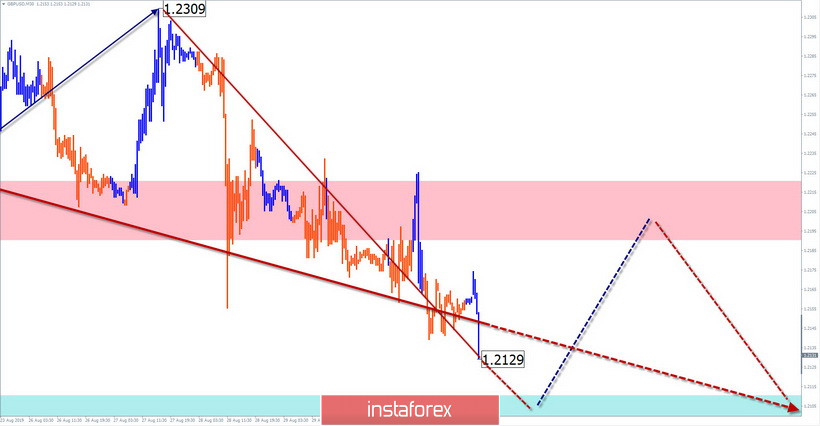
GBP / USD pair
A wave analysis of the last section of the British currency chart shows the beginning of the formation of a bearish wave. The potential reversal pattern looks like an expanding triangle. Meanwhile, the previously expected internal correction reached only the lowest possible level.
Forecast:
Today, the development of the described construction is expected to continue with a downward vector of the main course of movement. At the next session, a short-term rise in the price of a major is not ruled out. The range of daily fluctuations is limited by inverse zones.
Recommendations:
At the next trading sessions, it is recommended to give priority to pound sales. It is more reasonable for supporters of longer transactions to refrain from bidding until the upcoming rollback is completed and clear sell signals appear.
Resistance Zones:
- 1.2190 / 1.2220
Support Areas:
- 1.2110 / 1.2080
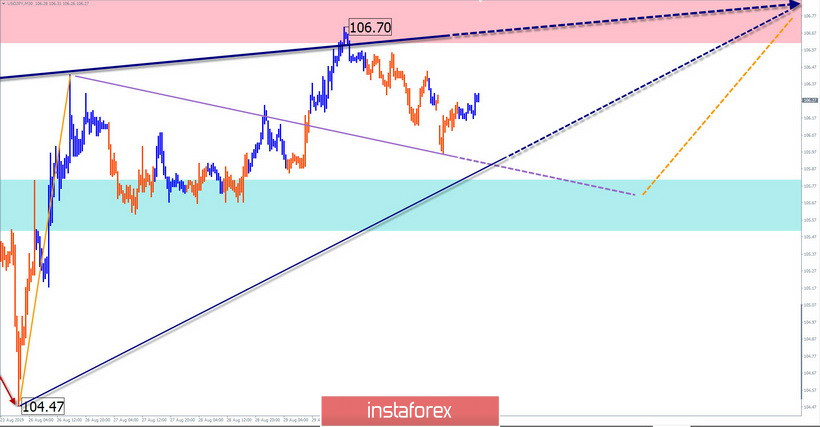
USD / JPY pair
Since August 6, a rising wave has been developing on the chart of the Japanese yen. The first 2 parts (A + B) are formed in its structure. From August 26, the initial zigzag of the final part (C) is formed. In recent days, the price has been rolling back.
Forecast:
Today, a continuation of the downward course is expected, until the complete completion of the entire current correction. Price reduction is likely no further than estimated support. By the end of the day, the chance of a price rise begins to increase.
Today, a continuation of the downward course is expected until the complete completion of the entire current correction. Price reduction is likely no further than estimated support. By the end of the day, the chance of a price rise begins to increase.
Recommendations:
Sales carry a high degree of risk and they should reduce the working lot. It is more promising to refrain from trading for the duration of the downward move and to look for buy signals in the support area of the pair.
Resistance Zones:
- 106.60 / 106.90
Support Areas:
- 105.80 / 105.50
Explanations to the figures: The simplified wave analysis uses waves consisting of 3 parts (A – B – C). Each of these analyzes the last incomplete wave. Zones show calculated areas with the highest probability of reversal. The arrows indicate the wave marking by the method used by the author. The solid background shows the formed structure and the dotted exhibits the expected movement.
Note: The wave algorithm does not take into account the duration of tool movements over time.
InstaForex analytical reviews will make you fully aware of market trends! Being an InstaForex client, you are provided with a large number of free services for efficient trading.


