 Stay
Stay 
Trading Conditions
Products
Tools


What does the existing V-shaped oscillation at the peak of the oblong correction look like? We will analyze this question and much more in our article.
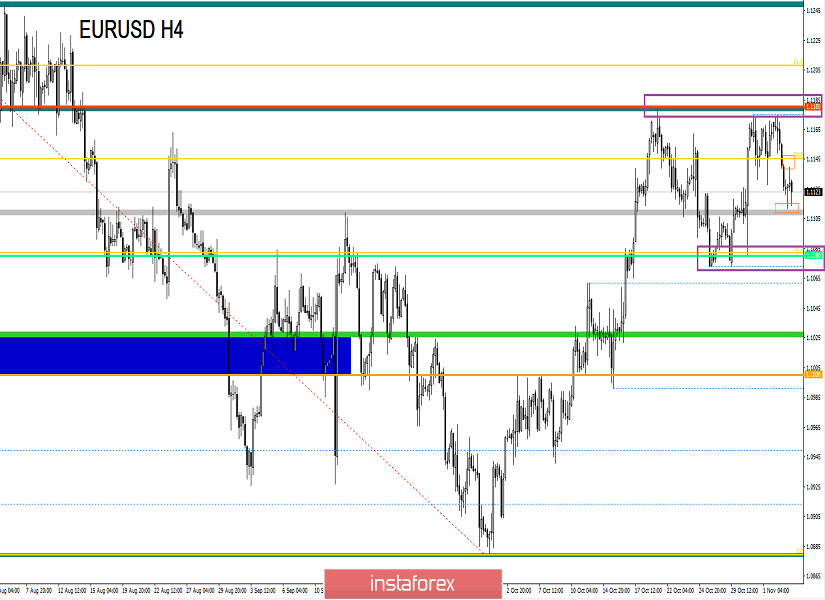
From technical analysis, we see that almost everything has returned to normal. The control level in the face of the resistance of 1.1180 firmly restrained the onslaught of buyers, slowing the upward move and as a fact forming a reverse oscillation. This kind of statement of trading forces stirred up many traders, and as a fact, they began to look for their patterns in the existing fluctuations. So the first thing that was noticed was a V-shaped oscillation, which was first dubbed as a "dimensional move" (continuation figure), after which they began to see in this same oscillation the prerequisites for the formation of a reversal figure (double/triple vertex). Is it all continuation/reversal figures, or maybe we are faced with a banal stagnation? And now really comes the gradual comprehension, look at the sequence of movements, variable volatility weakness, and skeptical traders. It all comes down to the fact that you need a stop, perhaps with a wide scope, but still, a stop that will help to withstand a small groove for reflection, and most importantly – the formation of the movement. If we study in more detail on the history of such a moment as an oblong correction, we will see that one of its stages is just flat, perhaps now it is on the market?
Analyzing the past day hourly, we see an intense downward movement from the beginning of the European trading session, which lasted almost until the end of the trading day. In this oscillation, there were two phenomena at once informational, which we will analyze a little later, and technical. So, in terms of the technical part, we have worked out the level of 1.1180, where against the background of local overbought stagnation was formed, which created an excellent platform for short positions.
As discussed in the previous review, speculators were in no hurry to act rashly and took a wait-and-see position, analyzing how the quotation would behave relative to its peak in the face of the level of 1.1180. Everything led to the fact that there were no open trades, but in the end, we got a small accumulation, right at the top of 1.1160/1.1175, where we went by the proven method of breaking the boundaries on a low volume. As a result, short positions were still opened, but not by all market participants, since on closer examination, we will see that the main framework of stagnation at the peak was the border of 1.1130/1.1180.
Looking at the trading chart in general terms (daily period), we see the whole same theory that we started discussing at the beginning of the article. The oblong correction in the main downward trend has come to the expected phase of stagnation, which will try to balance the existing market interest and in some way improve it.
The news background of the last day was the index of business activity in the manufacturing sector of Europe, which rose from 45.7 to 45.9. The United States released data on production orders, which recorded a decrease of 0.6%.
The market reaction to the statistics was, at first glance, inadequate, the US dollar went up, showing volatility equal to the daily average, but then everything fell into place when we studied the information background in detail.
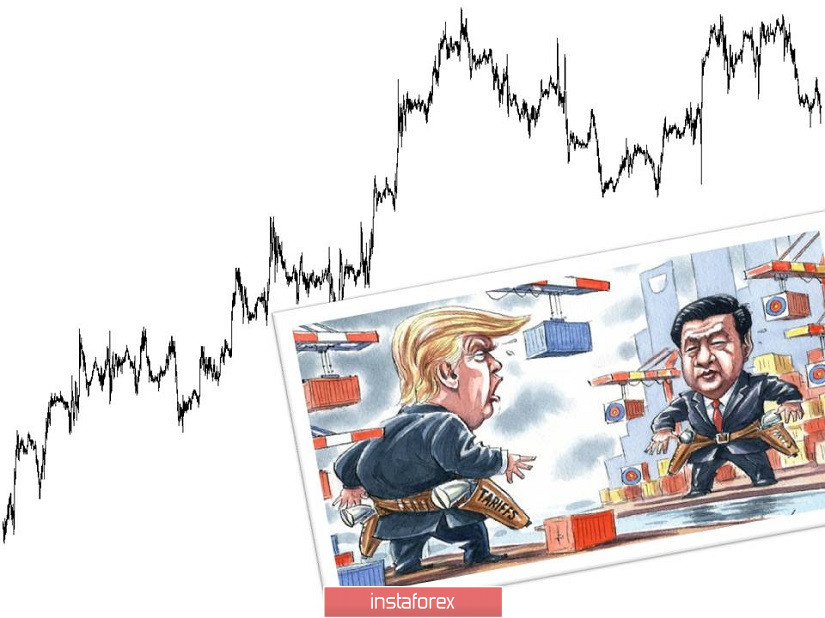
So, the driver of the growth of the US currency was the media sources, which were flooded with news about the alleged progress between Washington and Beijing in terms of a future trade agreement. According to several sources, the Chinese authorities are seeking from the United States the abolition of duties on Chinese goods for $112 billion, introduced in early September. In turn, the White House confirms this information that they are considering the possibility of lifting tariffs on several Chinese goods – in particular on clothing, household appliances, and monitors.
As we understand, the market reaction to any positive rumor/hints/comments about the protracted negotiations of the US&China results in the growth of the British currency, and now we understand the reason for yesterday's synchronization of statistics and the trading chart.
In terms of the beloved divorce proceedings of Brexit, there are no changes, only hope for a bright future. So, the British Prime Minister Boris Johnson, in the pursuit of the elections, continues to shout to all the well-known chants that Brexit will soon be postponed, and as soon as he wins the election, he will immediately submit to the parliament a deal about Brexit. Honestly, somewhere we already heard it. Let's see what happens this time, the Europeans have already done their part, the move is on the side of the United Kingdom.
Today, in terms of the economic calendar, data on producer prices in Europe have already been released, where the decline only accelerated from -0.8% to -1.2%. Across the United States, we are waiting for the publication of the non-manufacturing PMI (PMI) from ISM, with an increase of 52.6 – 53.5, as well as open jobs JOLTS, which should increase from 7.051M to 7.211 M.
Further development
Analyzing the current trading chart, we see that after a slight stagnation/pullback in the morning period, the market returned sellers, storming the minimum of the current period. So, the clock part of the supposed flat formation in the execution phase, where it faces the fulcrum of 1.1080 again.
Detailing the available time interval minute by minute, we see something similar to the oscillation of the pound/dollar pair, where the partial fixing of transactions in local jumps occurred in the Pacific and Asian trading sessions.
In turn, speculators, having a small share of fixing, continue to hold short positions, where they were helped by traders who came into the transaction at the time of passage of the corridor of 1.1130/1.1180.
It is likely to assume that the downward interest will remain in the market, where the quote will try to go down to the area of the level of 1.1080, where after the formation of a rebound is possible, in case of coincidence of the theory of flat formation. In turn, traders should carefully look through the news feed for information regarding the US&China negotiations, as well as the Brexit divorce agreement.
Based on the above information, we derive trading recommendations:
Indicator analysis
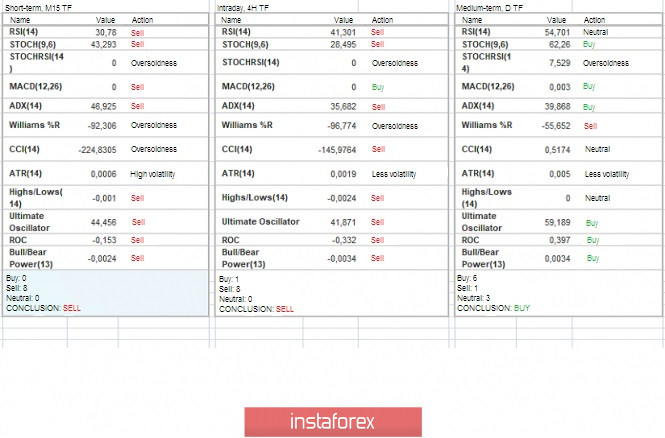
Analyzing different sector timeframes (TF), we see that the indicators in the short-term and intraday perspective moved into a phase of downward interest, signaling sales. The medium-term outlook unchanged signals an upward interest due to the inertial course, which was maintained even before the first touch of the level of 1.1180.
Volatility per week / Measurement of volatility: Month; Quarter; Year.
Measurement of volatility reflects the average daily fluctuation, calculated for the Month / Quarter / Year.
( November 5 was built taking into account the time of publication of the article)
The volatility of the current time is 28 points, which is the average for this period. It is likely to assume that in the case of maintaining the existing mood, volatility may still accelerate, but with a limit bar in terms of the level of 1.1080.

Key levels
Resistance zones: 1.1180*; 1.1300**; 1.1450; 1.1550; 1.1650*; 1.1720**; 1.1850**; 1.2100.
Support zones: 1.1080**; 1.1000***; 1.0900/1.0950**; 1.0850**; 1.0500***; 1.0350**; 1.0000***.
* Periodic level
** Range level
*** Psychological level
***** The article is based on the principle of conducting transactions, with daily adjustments.
InstaForex analytical reviews will make you fully aware of market trends! Being an InstaForex client, you are provided with a large number of free services for efficient trading.

