 Stay
Stay 
Trading Conditions
Products
Tools


4-hour timeframe
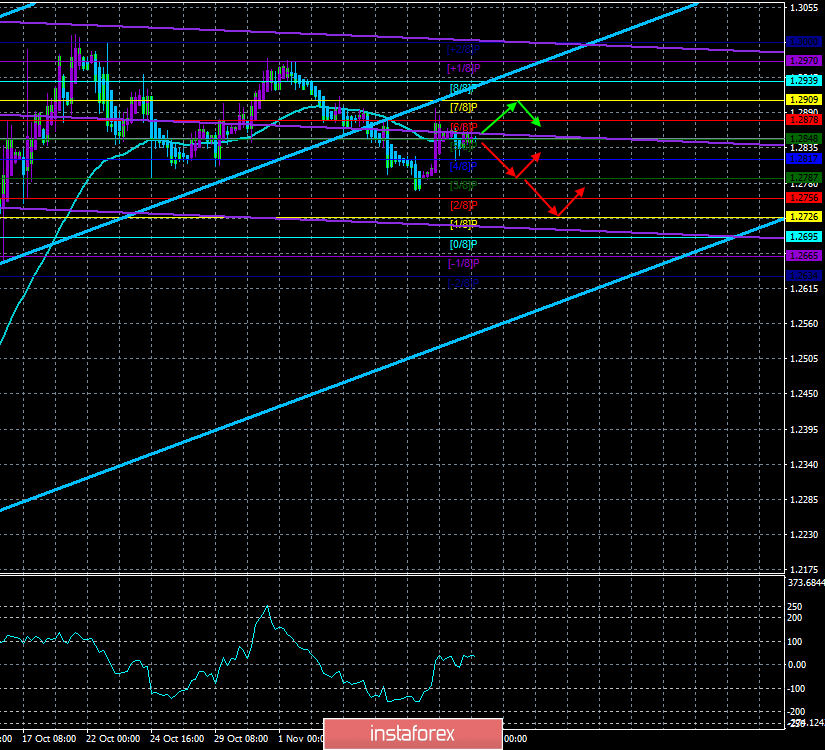
Technical data:
The upper channel of linear regression: direction – up.
The lower channel of linear regression: direction – down.
The moving average (20; smoothed) – sideways.
CCI: 32.1310
The British pound was finally bogged down yesterday. Trading throughout the day took place near the moving average line, which is directed sideways and indicates a flat on the pound/dollar pair. This is a very strange behavior of traders, as in the first two trading days of the week, there were plenty of macroeconomic statistics from the UK. However, forex market participants have not worked out reports on GDP, unemployment, wages, industrial production and now literally do not know where to move next? Buy a pound? But with absolutely failed statistics, this is impractical. Sell a pound? Why didn't they do it on Monday and Tuesday? We remain true to our view that for the pound, at least until December 12, the road is only one – down. In the best case for the British currency, this fall will simply not be strong but will be, for example, moderate. So far, it must be said that this moderate decline is observed. However, given such a strong fundamental backdrop on Monday and Tuesday, we expected to see stronger movements.
Traders were quick to calm down over Nigel Farage's claims of not wanting to compete with Boris Johnson's party in the election. The pound has grown a bit, but this is where all the euphoria of the market is over. And it ended correctly because such an attitude of the Brexit party towards the elections could negatively affect the number of its representatives in the British Parliament. Needless to say, no political force will simply give their seats in parliament and, accordingly, the opportunity to influence certain bills and put forward its own? Thus, from our point of view, the key question is: "Why does Farage's party support the conservatives?" After all, everyone remembers that the name of Boris Johnson was repeatedly associated with the name of Donald Trump. In principle, both the press and the politicians stated that they were friends, and the British prime minister even asked the US president to abolish duties on British whiskey. The American leader also supports Nigel Farage. And why? Yes, because both British politicians want to leave the EU as soon as possible, which is what Donald Trump needs. That's why Johnson and Farage are his friends. As for the coalition of Farage and Johnson in the parliamentary elections, it clearly shows collusion, since although the parties of both leaders support Brexit but its different scenarios. The Brexit party wants to leave the EU without any agreements. Johnson's party – on the "deal." Thus, it can hardly be assumed that the party "Brexit" suddenly began to suit the option of Boris Johnson and they decided to just give the conservatives a few dozen seats in parliament. Either way, there is collusion behind these events. The only question is, is there anything to oppose this collusion between Labor and the opposition forces?
Today, the UK will publish inflation for October, and the British pound will have a new portion of the chances of falling. The fact is that it is unlikely that inflation in the UK will begin to increase, given the macroeconomic statistics in the first two trading days of the week. Experts predict its slowdown to 1.6% y/y, and in monthly terms, traders can see the figure of -0.1%. Thus, inflation itself can cause a sell-off of the pound (which has been brewing for three days), as well as all macroeconomic statistics from Foggy Albion this week significantly increase the likelihood of a key rate cut by the Bank of England at the next meeting, which is also a factor in the fall for the currency of Britain. From a technical point of view, the pound/dollar pair stands still. And as long as it stands still, we recommend that you approach opening any positions with caution. The fundamental background will be strong today, but whether the pair will react to it remains a mystery.
Nearest support levels:
S1 – 1.2848
S2 – 1.2817
S3 – 1.2787
Nearest resistance levels:
R1 – 1.2878
R2 – 1.2909
R3 – 1.2939
Trading recommendations:
The GBP/USD pair has consolidated above the moving average, while volatility remains low. Formally, traders can now consider buying the pound with targets of 1.2878, 1.2909, and 1.2939. However, we still recommend trading small volumes or not trading at all. A downward movement of the pair remains more preferable but traders continue to ignore any macroeconomic reports, which makes it difficult for the pair to move in any direction.
In addition to the technical picture, fundamental data and the time of their release should also be taken into account.
Explanation of the illustrations:
The upper channel of linear regression – the blue lines of the unidirectional movement.
The lower channel of linear regression – the purple line of the unidirectional movement.
CCI – the blue line in the regression window of the indicator.
The moving average (20; smoothed) – blue line on the price chart.
Support and resistance – red horizontal lines.
Heiken Ashi – an indicator that colors bars in blue or purple.
Possible variants of the price movement:
Red and green arrows.
InstaForex analytical reviews will make you fully aware of market trends! Being an InstaForex client, you are provided with a large number of free services for efficient trading.


