 Stay
Stay 
Trading Conditions
Products
Tools

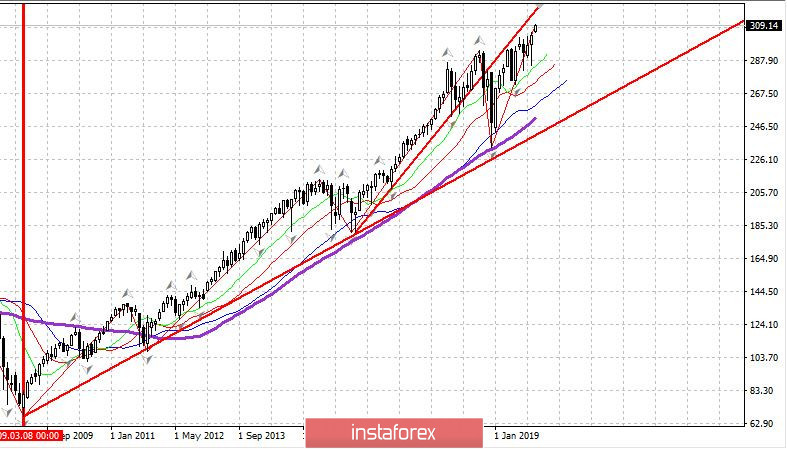
You see the monthly chart of the main US stock index - S&P 500.
Here you can see the entire growth cycle of the US market - from the lows of winter-spring 2008-2009, all ten years of growth.
We are at the peak.
Fidelity Investments Fund compellingly warns investors of the high risk of significant losses that remain in the stock market now.
The chart above is current, now it looks that way. Prices at such heights.
The potential for further growth is unlikely to be high.
But even if there is growth potential, do this: wait for a strong correction, clearly visible on the monthly chart. Think about strategic purchases only then.
InstaForex analytical reviews will make you fully aware of market trends! Being an InstaForex client, you are provided with a large number of free services for efficient trading.


