 Stay
Stay 
Trading Conditions
Products
Tools


Trend analysis.
This week, the price will move up with the first target of 1.1057 - a retracement level of 38.2% (blue dotted line). When breaking up this level, the next upper target will be the resistance line of 1.1064 (red bold line).
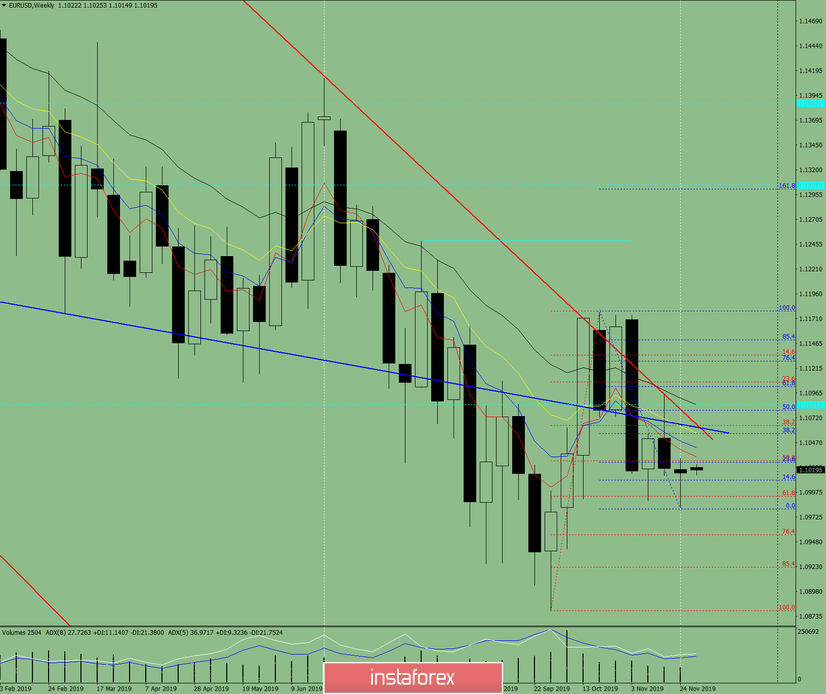
Fig. 1 (weekly chart).
Complex analysis:
- Indicator analysis - up;
- Fibonacci levels - up;
- Volumes - up;
- Candle analysis - neutral;
- Trend analysis - neutral;
- Bollinger Bands - down;
- Monthly chart - up.
The conclusion of the complex analysis - an upward movement.
The overall result of calculating the candle of the EUR/USD currency pair according to the weekly chart: the price of the week is likely to have an upward trend with the absence of the first lower shadow at the weekly white candle (Monday - up) and having a second upper shadow (Friday - down).
The first target when moving up is 1.1057 - a pullback level of 38.2% (blue dotted line). When breaking up this level, the next top target will be the resistance line of 1.1064 (red bold line).
Lower scenario - the first lower target of 1.0981 is the lower fractal (blue dotted line). If successful, the next lower target is a pullback level of 76.4% - 10955 (red dotted line).
InstaForex analytical reviews will make you fully aware of market trends! Being an InstaForex client, you are provided with a large number of free services for efficient trading.


