 Stay
Stay 
Trading Conditions
Products
Tools


Trend analysis.
In November, the price moved down and tested the retracement level of 61.8% - 1.0992 (blue dotted line) and closed above this level. And most importantly, the market closed below the resistance line of 1.1077 (red bold line) for the second candle in a row, thus showing that the trend reversal has not yet been decided. Most likely, it is possible to continue the upward movement in December.
In December, it is possible to continue the upward movement with the first target of 1.1122 - a pullback level of 14.6% (red dotted line). In case of breaking through this level, the next target is 1.1179 - the upper fractal (blue dotted line).
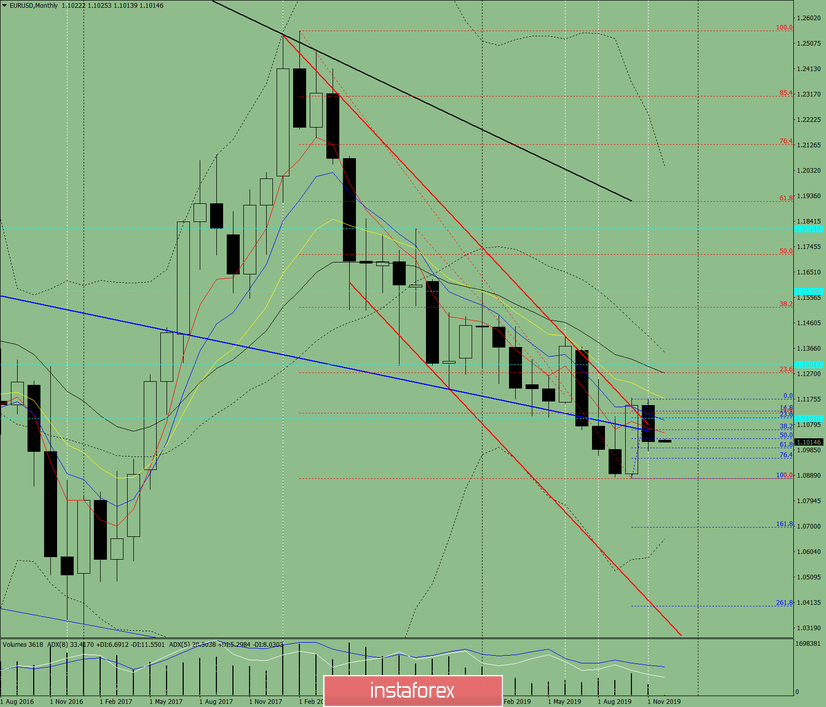
Fig. 1 (monthly chart).
Indicator analysis:
- Indicator analysis - up;
- Fibonacci levels - up;
- Volumes - up;
- Candle analysis - up;
- Trend analysis - neutral;
- Bollinger Bands - down;
The conclusion of the complex analysis - most likely, the top job.
The total result of calculating the candle of the EUR / USD currency pair according to the monthly chart: the price is likely to have an upward trend with the absence of the first lower shadow (the first week of the month - white) at the month-old white candles and the lack of the second upper shadow (the last week - white).
The lower scenario is unlikely. However, the first lower target of 1.0879 is the lower fractal (red dotted line).
InstaForex analytical reviews will make you fully aware of market trends! Being an InstaForex client, you are provided with a large number of free services for efficient trading.

