 Stay
Stay 
Trading Conditions
Products
Tools


To open long positions on EURUSD you need:
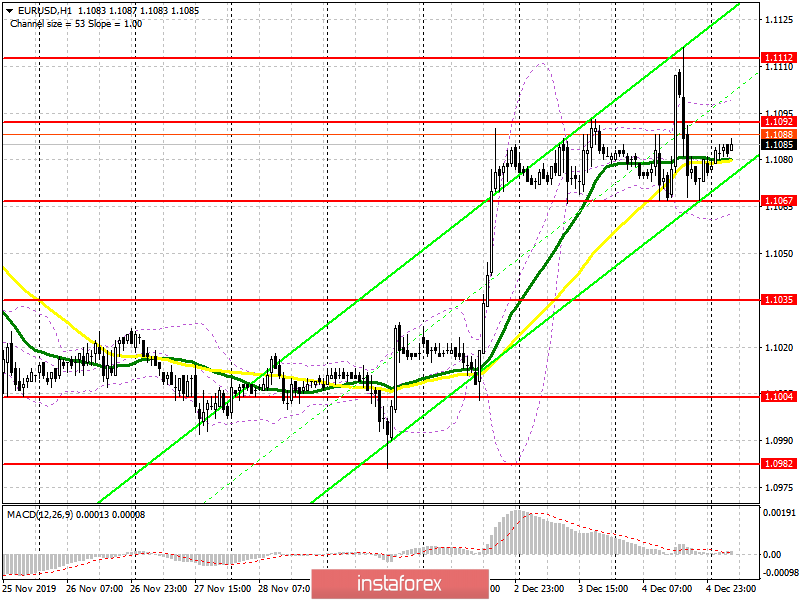
Yesterday, we watched how the unsuccessful breakout of resistance at 1.1092, which occurred along with the release of reports on the state of the US economy, led to the return of the EUR/USD pair to the narrow side channel in which it continues to be located now. Data on the growth in the number of new jobs in the US turned out to be worse than economists' forecasts, and activity in the non-manufacturing sector slowed down altogether. The entire focus of traders in the first half of the day will be shifted to today's report on eurozone GDP growth and retail sales. Only in case of good indicators, which you should not count on much, will the bulls break above the resistance of 1.1092, which will lead to the renewal of highs in the areas of 1.1109 and 1.1131, where I recommend profit taking. In the scenario of EUR/USD decline in the morning, it is best to open long positions after the formation of a false breakout in the support area of 1.1067, or to buy immediately for a rebound from a low of 1.1035.
To open short positions on EURUSD you need:
As yesterday, the bears will count on unsuccessful consolidation above the resistance level of 1.1092, which will be another signal to open short positions in the euro, the purpose of which will be the support of 1.1061, however, returning to the support level of 1.1034, where I recommend profit taking, will be more important. In the meantime, trade is conducted below the range of 1.1092, pressure on the euro will continue, and the market will remain on the side of sellers. With a EUR/USD growth scenario above the resistance of 1.1091 in the morning after good data on eurozone GDP, it is best to consider short positions after updating the high of 1.1109, or sell immediately for a rebound from the resistance of 1.1131.
Signals of indicators:
Moving averages
Trade is carried out in the region of 30 and 50 moving average, which indicates the lateral nature of the market in the face of important data.
Bollinger bands
The upper boundary of the indicator passes slightly above the resistance of 1.1092, in the region of 1.1100, while the breakout of the lower boundary of the indicator in the region of 1.1060 can increase the pressure on the euro.
Description of indicators
InstaForex analytical reviews will make you fully aware of market trends! Being an InstaForex client, you are provided with a large number of free services for efficient trading.


