 Stay
Stay 
Trading Conditions
Products
Tools


Oil - CL
From April 2011 to August 2014, the price of oil (WTI) formed an extended triangular graphic formation. In August 2014, the price went down from the triangle and plummeted until January 2016, reaching 26.14.
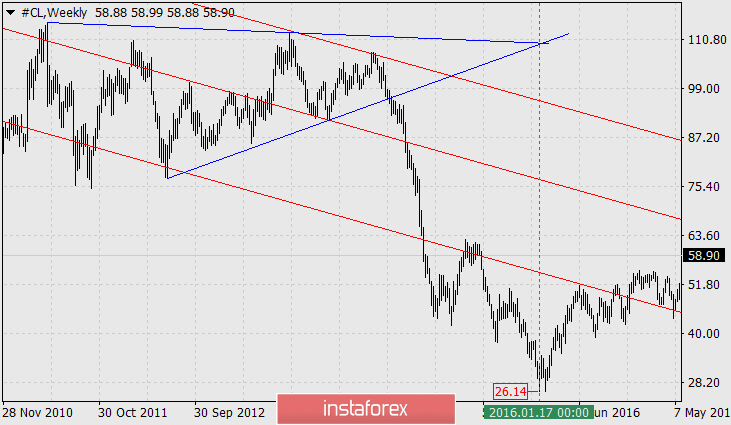
The oil drop at the exit from the triangle that lasted for 75 weeks, exactly to the time point where the lines forming the triangle converge. From a minimum of 26.14, a new life cycle of the growth-decline market began. Our task is to determine the completion of a new market cycle.
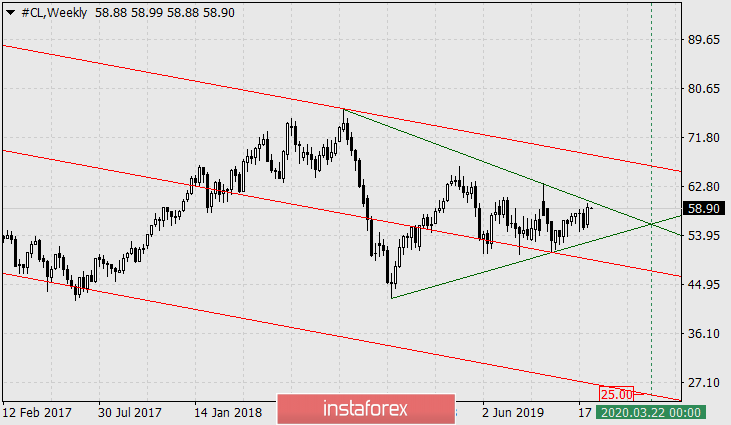
Now we see that the price has again formed a triangle, but this time it is smaller. The exit of the price from the triangle downward can provoke a 16-week fall before the end of March next year since the price in the second phase of the market's life cycle is in decline.
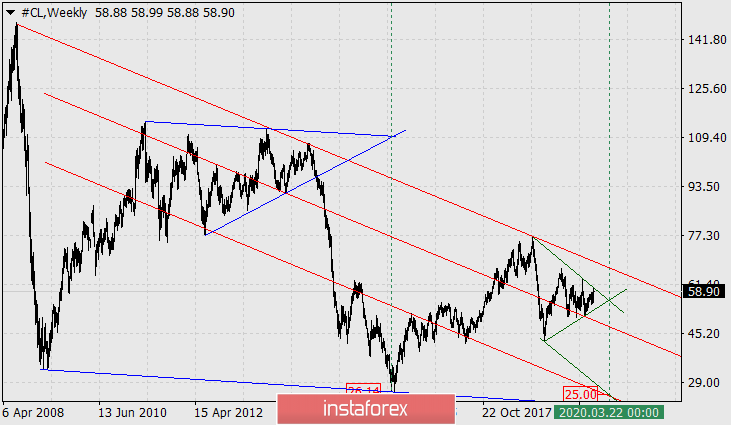
The upper generatrix of the large triangle, with its parallel downward movement to the minimum of February 2009, exactly coincides with the minimum of January 2016. The parallel line from the generatrix of the small triangle exactly coincides at the point with its time peak and the line of the price channel of red color. At the point of convergence of the lines, the price corresponds to 25.00 dollars. This is the magnetic point that the price is striving for.
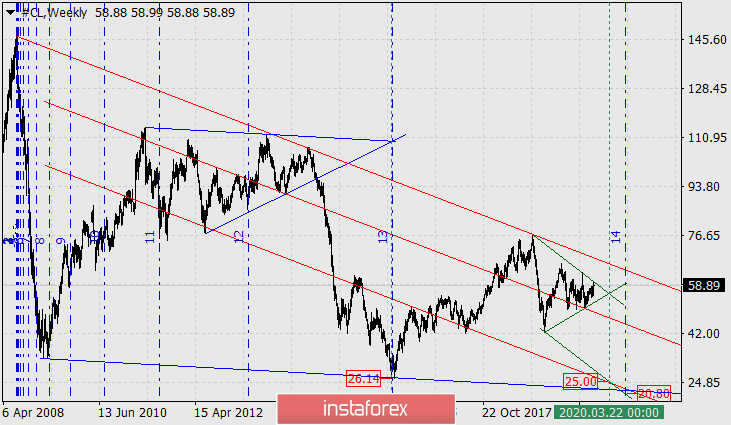
We determine the time range (time delta) of decline using Fibonacci time zones. We take the historical peak of the market in July 2008 as the starting point. Exactly on the 13th line, the previous market life cycle ended. The succeeding which is the 14th line indicates the middle of July 2020. The price, respectively, is slightly lower which is equivalent to 20.80 dollars per barrel.
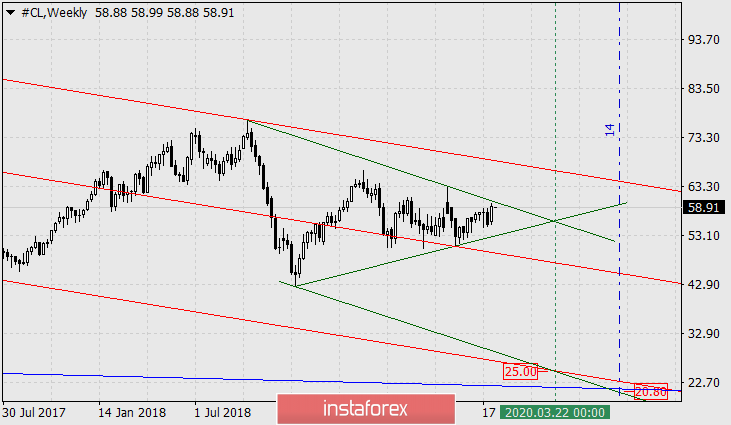
So, in the summer of next year, the price of oil may become even cheaper than it was at the height of the global crisis of 2008 and the boom in shale oil production in the USA against the backdrop of the 2016 "OPEC crisis", the target range is 20.80-25.00.
InstaForex analytical reviews will make you fully aware of market trends! Being an InstaForex client, you are provided with a large number of free services for efficient trading.


