 Stay
Stay 
Trading Conditions
Products
Tools


The pair moved up over the past week, but after almost reaching the retracement level of 61.8% - 1.1201 (blue dotted line), the price went down and closed below the retracement level of 23.6% - 1.123 (red dotted line). The price in the coming week will try to continue moving up.
Trend analysis.
This week, the price will move up with the first target of 1.11199 - the upper fractal (red dotted line). If you break through the top of this level, the next top target will be a pullback level of 76.4% - 1.1276 (blue dotted line).
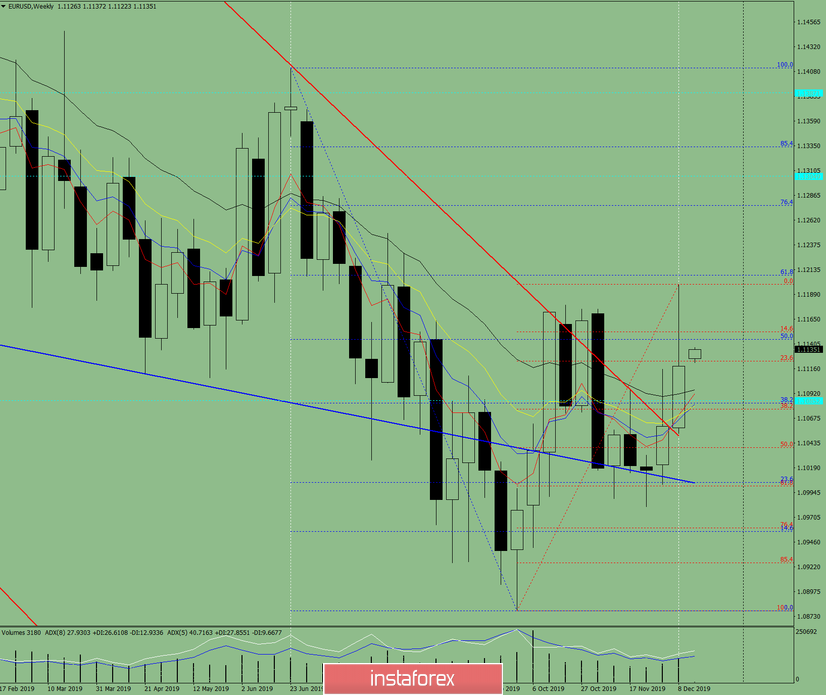
Fig. 1 (weekly chart).
Complex analysis:
- Indicator analysis - up;
- Fibonacci levels - up;
- Volumes - up;
- Candle analysis - up;
- Trend analysis - top;
- Bollinger Bands - up;
- Monthly chart - up.
The conclusion of the complex analysis - an upward movement.
The overall result of calculating the candle of the EUR/USD currency pair according to the weekly chart: the price of the week is likely to have an upward trend, with the absence of the first lower shadow of the weekly white candlestick (Monday - up) and the absence of the second upper shadow (Friday - up).
An unlikely lower scenario - a 50% retracement level (blue dotted line) from the level of 1.1145. The first lower target of 1.1076 is a retracement level of 38.2% (red dotted line). If successful, the next lower target is the pullback level of 50.0% - 1.1039 (red dotted line).
InstaForex analytical reviews will make you fully aware of market trends! Being an InstaForex client, you are provided with a large number of free services for efficient trading.


