 Stay
Stay 
Trading Conditions
Products
Tools


The US dollar continues to systematically decline against the Japanese yen, and it is already quite strong. However, FOMC protocols can support the US currency and the pair USD/JPY is quite capable of adjusting and reducing existing losses. On the other hand, a scenario is possible in which the dollar will come under pressure.
Everything will depend on what is reflected in the protocols and how market participants will react to this. Recently, many Fed leaders have expressed the view that the refinancing rate will remain unchanged in the near future. Representatives of the Federal Reserve said that the economic situation is quite stable and there is no need to change the parameters of monetary policy.
In this regard, it can be assumed that the same rhetoric will find its place in today's protocols, which will be published at 19:00 (Universal time). If this assumption is correct, then much of the price dynamics of the US dollar will depend on various nuances. In general, I believe that after the publication of the protocols, cardinal changes will not occur. Increased volatility and sudden movements to each side are quite possible, but in order to win back all the losses incurred at the moment, you need a truly extraordinary positivity and where does it come from?
Weekly
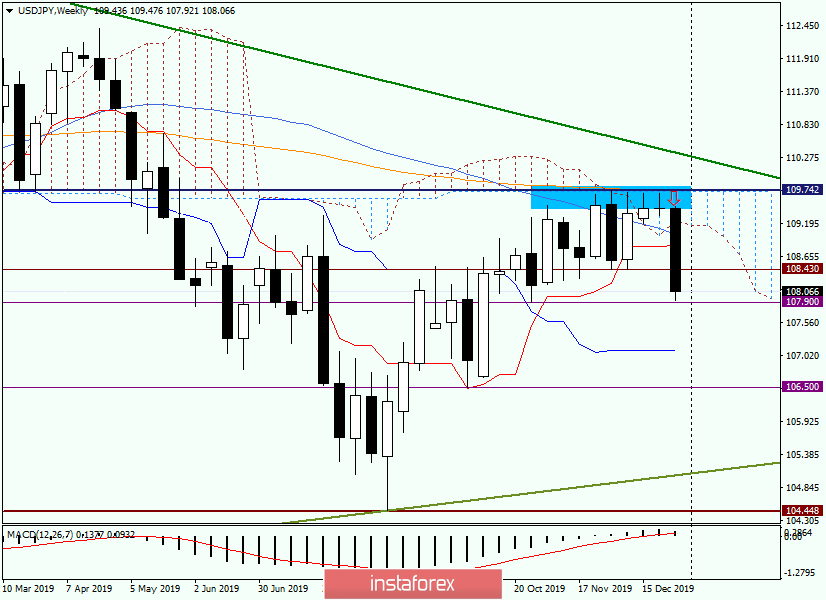
Now, contrary to my own principles again, I will begin the technical part of this review with a review of the weekly schedule. A significant decline, which began after the players' inability to increase to break above the strong resistance of sellers in the area of 109.75, reached the support of 107.90. As you can see on the graph, this is a fairly strong technical level, from which there are attempts to bounce.
We must immediately determine that the closure of weekly trading below 107.90 will open the way to the Kijun line of the Ichimoku indicator, which runs at 107.10. The breakdown of Kijun and consolidation at a significant level of 107.00 may trigger a continuation of the downward trend to the area of 106.50, where support is also taking place. In my opinion, it's still too early to talk about the further goals of sellers. Let's see how things are on the lower time frames.
Daily
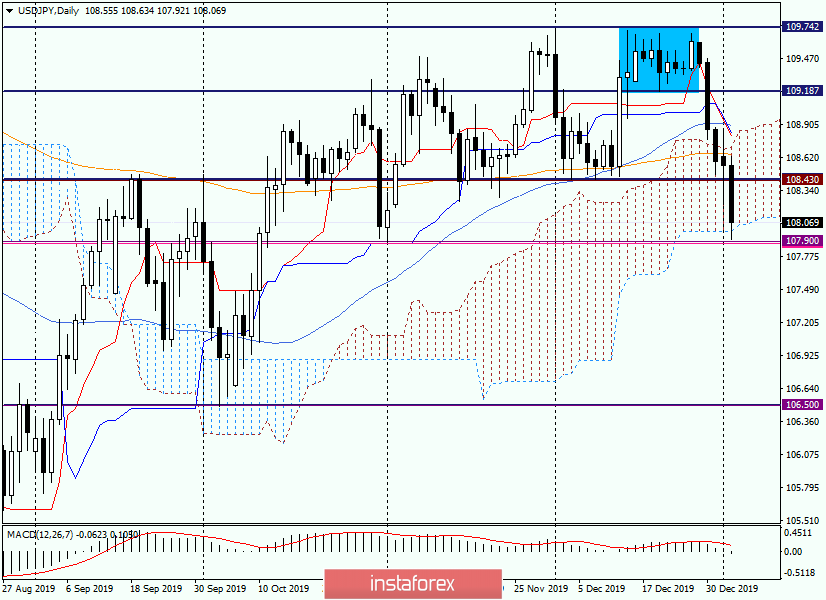
On the daily chart, there is a struggle between the opposing sides for going down from the Ichimoku cloud. Naturally, the bears try to push the pair down, but the situation is complicated by the presence of the support level of 107.90, which is the reason for the upward rebound together with the lower border of the cloud. It is very interesting and important how long the current rebound will be and what kind of day candle will eventually form.
I do not exclude that today's candlestick will be with a long lower shadow and a closing price in the region of 108.20-108.40 but we will see. The situation is not simple and extremely important. I believe that a lot will be decided at the end of today's auction, after the publication of the FOMC protocols.
H4
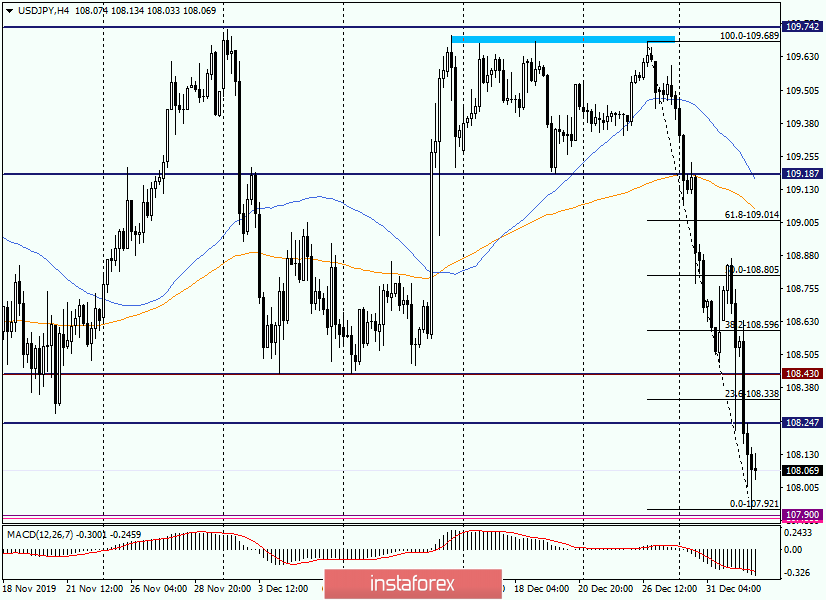
On this time frame, the downward movement is particularly noticeable. Thus, you can expect a course correction given the last closed candle with a long lower shadow. In this regard, I stretched the grid of the Fibonacci instrument to decline to 109.69-107.92.
As I have repeatedly expressed my opinion, the correction is often limited to the first pullback level of 23.6 Fibo after such strong movements. It is characteristic that in our case 23.6 Fibo is located at 108.33, that is, it falls into the area indicated above 108.20-108.40. From a technical point of view, climbing to 23.6 is a good option for opening short positions on USD/JPY. Moreover, sales at more attractive prices are worth looking for when the rate rises to the area of 108.60-108.80, where in addition to the strong levels themselves, there are 38.2 and 50.0 Fibo levels from a decrease of 109.69-107.92.
However, I consider purchases to be more risky. Why not wish to buy in the support area 107.90-108.00? In addition, the stop is small at 107.92, although the profit is small, it's the same price range 108.20-108.40. However, staying ahead of the close of weekly trading and ahead of the publication of Fed protocols outside the market is also a position. In any case, the decision is individual.
Good luck!
InstaForex analytical reviews will make you fully aware of market trends! Being an InstaForex client, you are provided with a large number of free services for efficient trading.

