 Stay
Stay 
Trading Conditions
Products
Tools


Trend analysis.
This week, the price strayed from the support line of 1.3027 (the white bold line) and it will move up with the target of 1.3223 - the resistance line (black bold line). In case of a breakout, continue working up with the target of 1.3283 - the upper fractal.
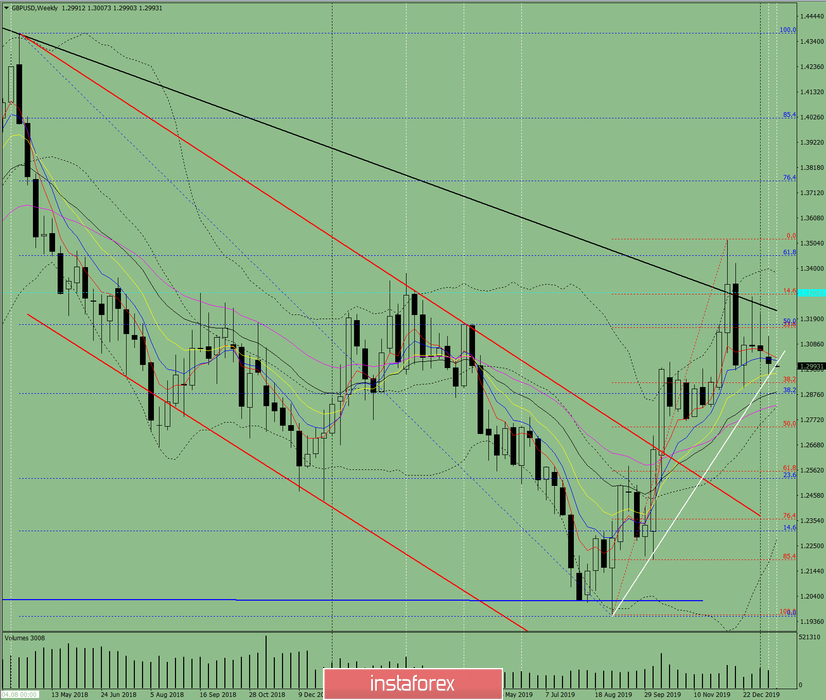
Fig. 1 (weekly chart).
Complex analysis:
- Indicator analysis - up;
- Fibonacci levels - up;
- Volumes - up;
- Candle analysis - up;
- Trend analysis - up;
- Bollinger Bands - up;
- Monthly chart - up.
The conclusion of the complex analysis - an upward movement.
The overall result of calculating the candle of the GBP/USD currency pair according to the weekly chart: the price of the week is likely to have an upward trend with the absence of the first lower shadow of the weekly white candlestick (Monday - up) and the presence of the second upper shadow (Friday - down).
An unlikely but possible scenario: from the support line of 1.3010 (the white bold line), work down with the first target of 1.2904 - the lower fractal.
InstaForex analytical reviews will make you fully aware of market trends! Being an InstaForex client, you are provided with a large number of free services for efficient trading.


