 Stay
Stay 
Trading Conditions
Products
Tools


"Everyone chooses their own path. And the more obvious the goal, the easier the path"
Good morning, dear colleagues.
With you, as always, is Sergey Denisov and the forecast for the likely movement of the GBP / USD currency instrument.
"The forecast for WTI oil is expected today - don't miss it !!!"
This forecast for the current trading week of January 27-31, 2020 will be the main one: the goals and possible ways to achieve them will be relevant for at least a week. All subsequent forecasts will be derived from this forecast and lead us to the "cherished goal" in the form of profit!
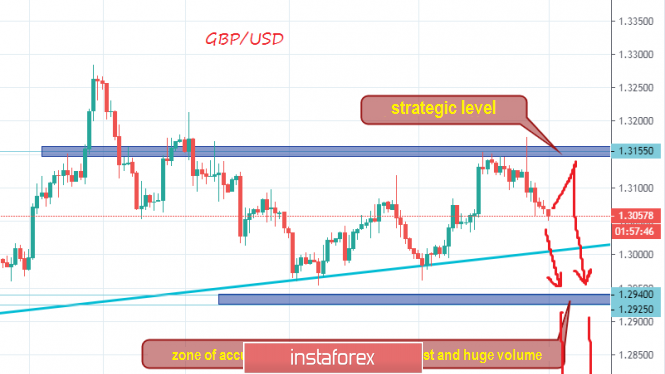
Every trading day with GBP / USD is like a "holiday" - it's fun and you never know when it will end. This happened in the trading session on January 20-24, 2020: for four days in a row, the pound pleased the bulls immensely, updating local highs and doing it on impulses as well. Well, just happiness! However, on Friday, January 24, the "bulls" were no longer laughing - making a false break * ("loading" into the market of buyers) and "removing" the stops from sellers, where do you think the price went? Down, of course! Classic!
The forecast for the current trading week, January 27-31, 2020, will be as follows: SELL - priority with a goal of 1.2925 and an ambitious, but very real, goal of 1.2680. The goals will be fulfilled either immediately at the current price, or after a corrective growth to the level of 1.3155, where the strategic level ** is located. Now, let me try to justify this statement:
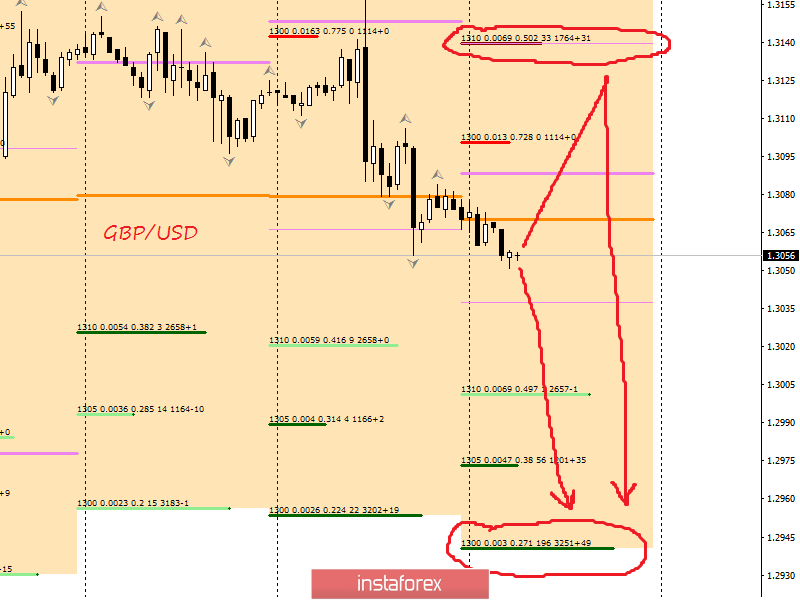
Here, dear colleagues, is what will "guide" me this week on trading in GBP / USD.
Dear colleagues, please follow the publication of forecasts for GBP / USD during the trading week, to not miss anything important and eventually get a profit!
IMPORTANT !!! I will publish my thoughts on macroeconomic analysis for several trading instruments on January 28. Don't miss it !!!
False breakdown * - some are convinced that it is impossible to determine it, while others claim that they have solved this mystery. I, "from my bell tower", will say this: after updating the local high on a sharply rising one, we will have an impulse breakout, which in the case of subsequent absorption, may well "deserve" the status of a "false breakout ".
The strategic level ** is the level where the price returns (tests) in 80% of cases. I generate these levels by finding the price movement on the chart caused by a large absorption of prices and volumes with its own sharply increased volume.
I understand that it is probably too "sophisticated" written here. In subsequent publications, I will try to give examples. Don't miss it !!!
IMPORTANT! Keep in mind that you should enter the market only using patterns - graphic figures that are frequently repeated on the market, where as a result of their formation, there is a certain pattern of price behavior in the future.
In my trading, I use patterns consisting of candlestick analysis and volume analysis. One of my favorite patterns is updating local highs on a sharply rising volume with subsequent testing up to 50% -61.8% Fibo.
Thank you for your attention, dear friends.
InstaForex analytical reviews will make you fully aware of market trends! Being an InstaForex client, you are provided with a large number of free services for efficient trading.


