 Stay
Stay 
Trading Conditions
Products
Tools


From a complex analysis, we see a second attempt to break the psychological level of 1.1000, which was unsuccessful. The level stands firmly in place, and without unnecessary actions, accumulation is formed with extremely low activity. We are faced with a turning point, where there are more than enough people willing to accelerate, but there is no push for drastic actions yet. So it turns out that market participants are at a low start, where at the slightest inertia and fixation outside the set coordinates, sharp injections into the market will occur.
Regarding the recovery theory, it all comes down to the second stage (1.1000), where there is extensive discussion. So, the opinions of traders are divided, some refer to a strong inertial move from the beginning of the new year, based on which sellers will be able to hold on and as a fact overcome the stage with the transition to the final stage of recovery relative to the oblong correction. Other traders point to repeated attempts to break the level on the history, which were not successful, the current fluctuation is not much different from the past and the probability of a rebound remains.
Both judgments are correct but do not forget that levels are not eternal, and if you refer to the inertial move from the beginning of January, then we now have a conditional overheating of short positions, then why, with such a successful combination of circumstances, the price did not rebound from such a strong cardinal. Perhaps the four-month oblong correction has outlived its time and the moment has come for the restoration of the global downward trend.
From volatility, we see that since the beginning of the trading week, activity has decreased significantly, which reflects the slowdown and as a fact accumulation, which is likely to lead to acceleration, if we refer to the patterns of market dynamics in general.
(Daily variation: 28 points - Monday; 27 points - Tuesday; 35 points - Wednesday)
Analyzing the past day by the minute, we see another V-shaped formation, where the first bar was in the interval of 02:30-16:00, and the second fell on the period of 16:30-21:30.
As discussed in the previous review, traders are in standby mode, analyzing the behavior and price-fixing points relative to the coordinates of 1.0980 and 1.1040.
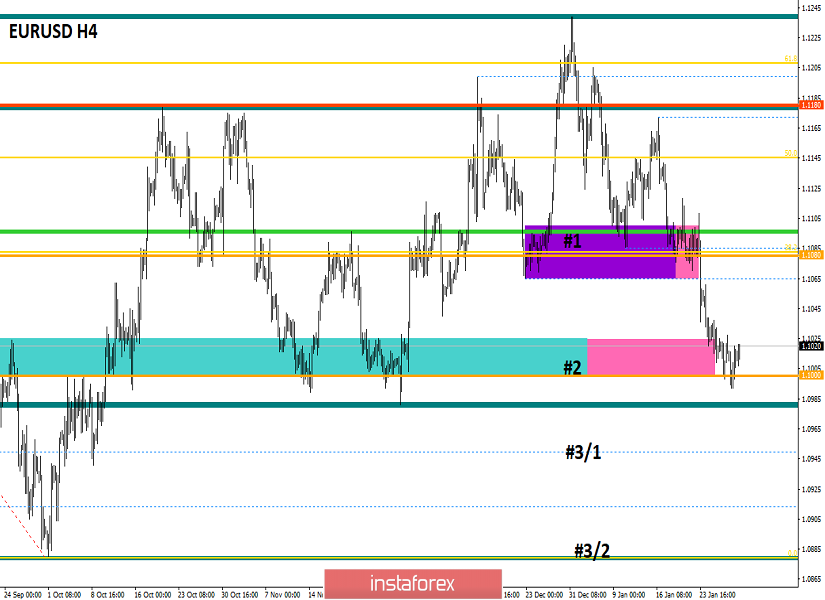
Looking at the trading chart in general terms (the daily period), we see a downward trend set by the market in early 2018, in the structure of which an oblong correction from October 1, 2019, is developing. The global trend, which is more than 10 years old, is also a downward trend.
The information and news background of the past day included the most important event of the week - the meeting of the Federal Reserve System, where the regulator predictably left the rate at the same level of 1.5-1.75%. The Committee believes that the current monetary policy is considered rational to support stable growth in the country's economy, a strong labor market, and to achieve the inflation target.
"When determining the timing and size of future adjustments to the target range of interest rates on federal credit funds, the Committee will assess both the already implemented and expected economic conditions in comparison with the target indicators: maximum employment and inflation at the level of 2%. This assessment will take into account a wide range of information, including indicators of labor market conditions, indicators of inflationary pressure and inflation expectations, as well as data on financial and international events," the FOMC document notes.
It is worth noting that the Committee and its head so masterly scrolled comments and wording of monetary policy that they did not answer any question of concern to investors, and what's next? Given such a strong silence in terms of further actions and the preservation of all that was known at the previous meeting, the market did not react in any way, or rather, hid in ambiguity.
Today, in terms of the economic calendar, we have already received data on the unemployment rate in Europe, where we recorded a decline from 7.5% to 7.4%, which did not affect the single currency. In the second half of the day, we are waiting for data on applications for unemployment benefits in the United States, where no changes are expected, primary +6 thousand, repeated -6 thousand.
Further development
Analyzing the current trading chart, we see a persistent stagnation within the psychological level of 1.1000, where the accumulation limits are still unchanged at 1.0990/1.1027. This stability is a bit frightening, because at the slightest preponderance of trading forces, there may be a surge in the market, which may be local, but a lot of trading volumes will drown in it. It doesn't make much sense to say that the level of 1.1000 will be broken or will not be broken since you can earn first of all on the breakdown of accumulation, regardless of the main course. After the flight, we will talk with you about the great and strategic moves, but in the meantime, we earn profits.
In terms of the emotional component of the market, we see the high speculative interest that is on the verge of being published.
In turn, traders are waiting for the go-ahead as soon as the price breaks through the accumulation boundaries and reaches the specified coordinates of the start of trading positions.
It is likely to assume that there is not much time left to wait, and if we analyze the correlated GBPUSD pair, we will see that everyone is waiting, and not only for the euro. Thus, as soon as there is an increase, it will be reflected everywhere, and one will pull the other. The trading strategy remains the same, we sit outside the market and wait for solid exits from the accumulation, where the key coordinates are the values of 1.0980 – sell and 1.1040 – buy. In this context, we are talking about fixing the price, not a shadow puncture.
Based on the above information, we will output trading recommendations:
- Buy positions will be considered in the event of a breakdown of the accumulation and fixing the price higher than 1.1040.
- Sell positions are considered if the downward interest is held and the price is fixed below 1.0980, without the shadow piercing the candle. The perspective of the move is located in the following stages: #3/1-1.0950 and #3/2-1.0879.
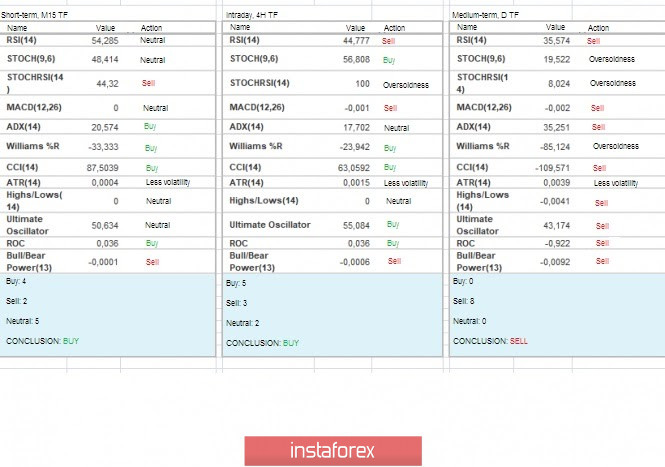
Indicator analysis
Analyzing different sectors of timeframes (TF), we see that due to persistent accumulation, the indicator analysis produces a multidirectional signal relative to the minute and hour periods. In turn, the daily sections still retain downward interest.
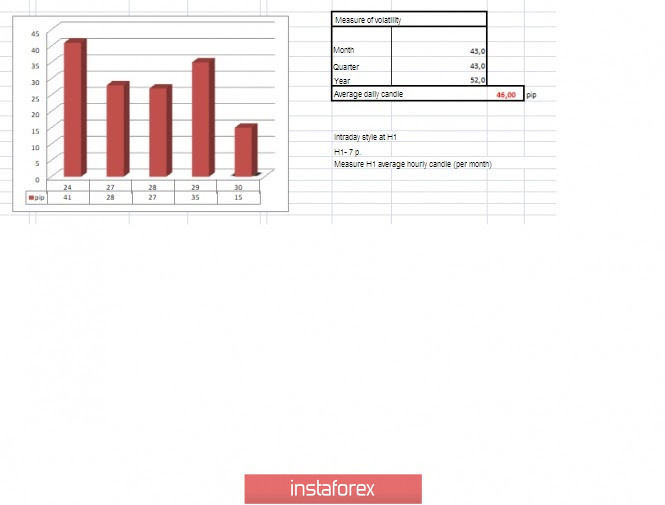
Volatility for the week / Volatility Measurement: Month; Quarter; Year.
The volatility measurement reflects the average daily fluctuation, based on the calculation for the Month / Quarter / Year.
(January 30 was based on the time of publication of the article)
The volatility of the current time is 15 points, which is extremely low for this period. It is likely to assume that due to the breakdown of accumulation, we will see a sharp acceleration in volatility.
Key levels
Resistance zones: 1.1000***; 1.1080**; 1.1180; 1.1300**; 1.1450; 1.1550; 1.1650*; 1.1720**; 1.1850**; 1.2100.
Support zones: 1.1000***; 1.0900/1.0950**;1.0850**; 1.0500***; 1.0350**; 1.0000***.
* Periodic level
** Range level
*** Psychological level
***** The article is based on the principle of conducting a transaction, with daily adjustments.
InstaForex analytical reviews will make you fully aware of market trends! Being an InstaForex client, you are provided with a large number of free services for efficient trading.


