 Stay
Stay 
Trading Conditions
Products
Tools

On September 27th our analysis on TSLA stock price was bullish. Price was then breaking important resistance levels and we noted that a new bullish signal was given. Price since then has reacted exactly as bulls would want.
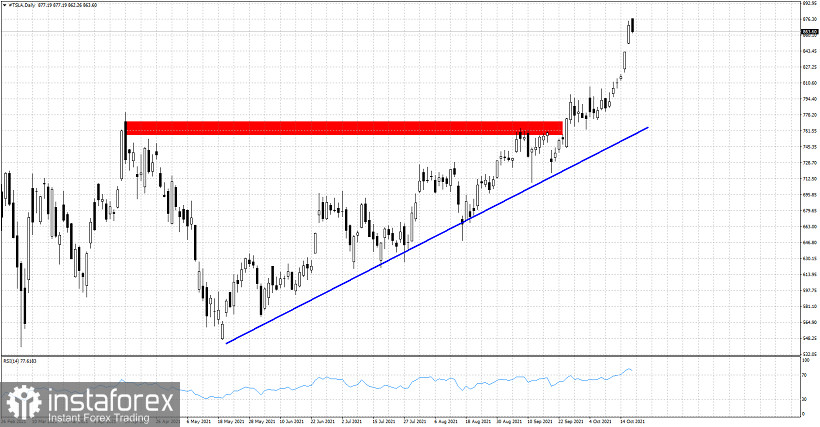
Blue line -support trend line
TSLA stock price has risen 15% since the day of the break out. Price remains in a bullish trend making higher highs and higher lows. The RSI in the Daily chart has reached overbought levels. At least a short-term pull back is justified from current levels. Bulls should not be greedy. Bulls should take partial profits, although there are high chances this trend continues, a short-term pull back is expected over the next few days. Trend remains bullish as long as price holds above the blue trend line.
InstaForex analytical reviews will make you fully aware of market trends! Being an InstaForex client, you are provided with a large number of free services for efficient trading.


