 Stay
Stay 
Trading Conditions
Products
Tools


Is it time to sell?
Hello, dear traders!
In this article, we will consider the technical picture that is observed for the dollar/yen currency pair. But before that, I would like to remind you of the most important event this week.
Tomorrow at 20:00 (London time), the minutes of the last meeting of the Open Market Committee (FOMC) of the US Federal Reserve will be published. As a rule, investors carefully study the published protocol in order to get information from it about the future actions of the Federal Reserve System (FRS) in monetary policy. Usually, the market has a fairly rapid reaction to the publication of the protocols, volatility increases sharply, so be careful!
Weekly
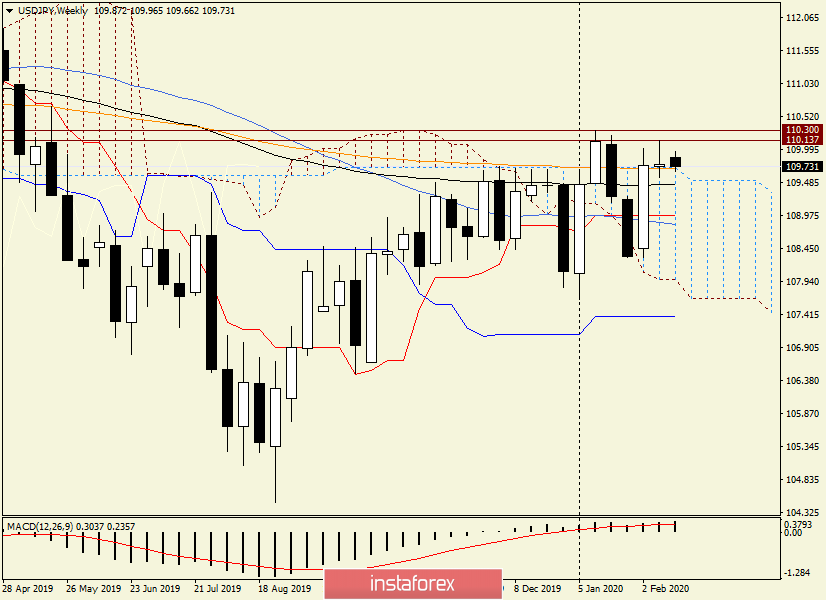
Now to the price charts, and let's start with the weekly one. Here, the candle of the past week in the form of "Long-Legged Doji" immediately catches the eye. Such candle models have one of the shadows larger than the other, which indicates the balance of forces in the market. The "our" candle had a long upper shadow. This factor shows serious problems for buyers with further price movement in the north direction.
Interestingly, the closing price of last week's candle is just above the upper limit of the Ichimoku indicator cloud, but in this case, the candle itself is more important, which carries a reversal character.
If you go back to last week's closing price, the decline was limited to the 144 exponential moving average, which provided the pair with strong support. In many ways, this is why the trading closed above the upper border of the cloud.
I believe that the breakdown of the 144 EMA and the closing of the current weekly session within the Ichimoku indicator cloud will largely indicate bearish sentiment for USD/JPY. However, there is an 89 EMA at 109.45 that can provide support, but even if the trades close above it, but within the cloud, this can already be considered as a bearish signal.
The breakdown of the resistance zone of 110.14-110.30 signals an alternative bullish version of the trading development. Only a close above 110.30 will indicate that serious buyers have entered the market and can be expected to move in a northerly direction.
By the way, if anyone remembers, I repeatedly designated the mark of 110.20 as a technically very strong level and assumed that the pair could circle around the psychological mark of 110.00 for some time.
Daily
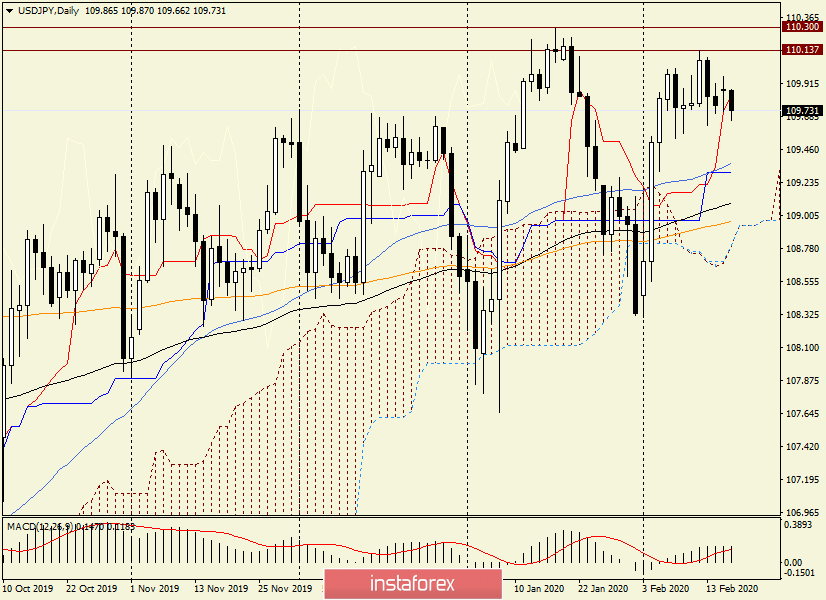
Here, the picture is not as clear as on the weekly timeframe. If the pair was supported by the Tenkan line yesterday, then at the moment of writing, the dollar/yen is trading below this line. If today's trading ends under the Tenkan line, this will be another bearish signal. In this case, the pair will head to the area of 109.37-109.30, where the Kijun line of the Ichimoku indicator and the 50 simple moving average are located. Below, near the extremely important mark of 109.00, there are 89 and 144 exponential moving averages.
H4
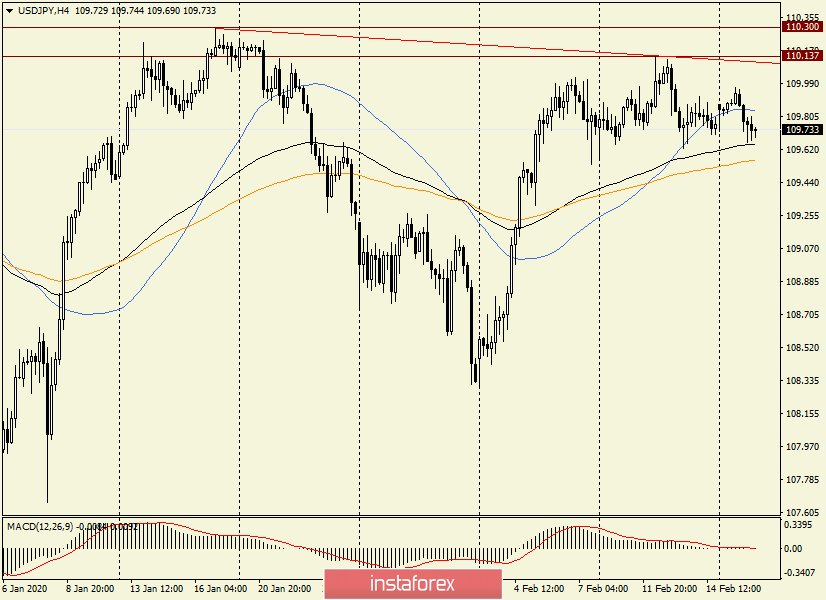
On this chart, it is worth noting that each subsequent maximum is lower than the previous one. This is a bearish signal.
If we talk about trading recommendations, then, in my opinion, the most relevant are sales, the closest of which you can look at after the pair rises to the price zone of 109.65-109.85. More distant prices have already been mentioned - this is the resistance zone of 110.00-110.30.
At the same time, it is necessary to take into account that a true breakdown of the level of 110.30 and fixing it above it (this is a true breakdown) will negate the bearish scenario, which I consider the most relevant at the moment.
Good luck!
InstaForex analytical reviews will make you fully aware of market trends! Being an InstaForex client, you are provided with a large number of free services for efficient trading.

