 Stay
Stay 
Trading Conditions
Products
Tools


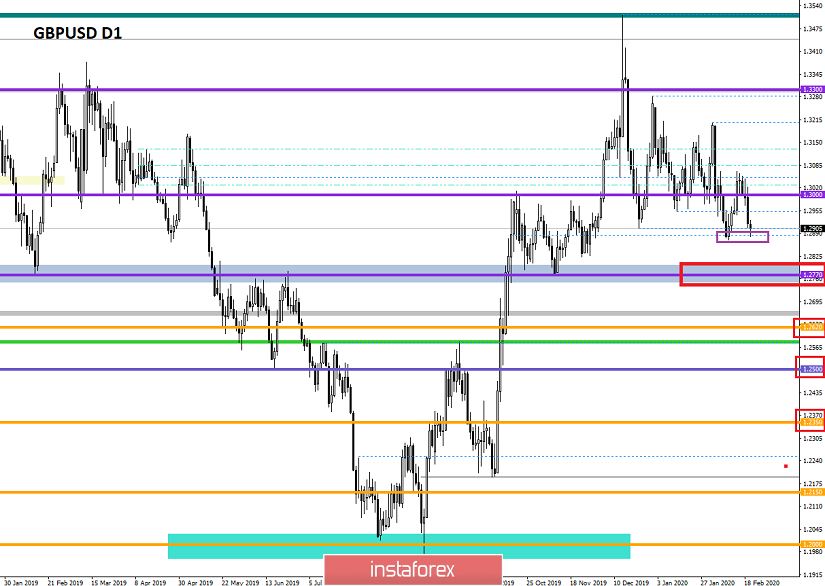
From a comprehensive analysis point of view, we see a downward rally where the quotes have almost reached the point of interaction of trading forces. For the details, the oscillation within the psychological level of 1.3000 ended successfully with acceleration in the downward direction, where the quotes went down to the area of 1.2900, which means that a few points are left to the point of interaction [1.2885] . The outcome of the past corrective movement was predetermined at the beginning of the phase, where they did not expect a cardinal return due to the existing change in such a component. In fact, the level of 1.3000, which held us back for almost three days, was a point of accumulation and was no longer the very important coordinates that were a period earlier.
Regarding the downward movement theory, we see that the quotes' movement occurs again within the range of 1.2770 // 1.2885 // 1.3000, which means that a change in the clock component is confirmed where lowering the price is possible. It is worth considering that now the theory confirms a change in tact, but not a restoration of the downward trend relative to the medium-term move. To confirm this theory, quotes need to be fixed below 1.2770, which will reflect more than 50% of mining relative to the medium-term trend and, as a fact, will signal a recovery process.
In terms of volatility, we see the first acceleration since the beginning of the week, where the quotes crossed the threshold of the daily average. Let me remind you that for almost two weeks the quotes had a stable indicator in the region of 76 points, which reflected a kind of consolidation and willingness to develop new scenarios.
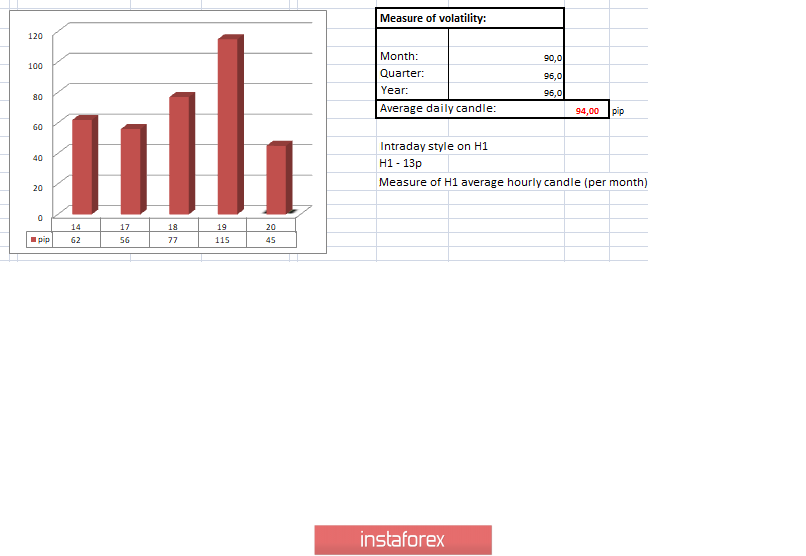
Details of volatility: Thursday - 79 points; Friday - 79 points; Monday - 74 points; Tuesday - 74 points; Wednesday - 44 points; Thursday - 125 points; Friday - 62 points; Monday - 56 points; Tuesday - 77 points; Wednesday - 115 points. The average daily indicator relative to the dynamics of volatility is 94 points [see table of volatility at the end of the article].
Detailing the minute by minute, we see that the main surge of activity occurred in the period from 11:30 - 18:00 UTC [time at the trading terminal], where downward interest prevailed. The subsequent fluctuation was in terms of local stagnation, within 20 points.
As discussed in a previous review, medium-term traders work on the decline, following the theory of recovery. Intraday traders worked relative to the limits of accumulation, where the passage of the 1.2970 mark gave a sell signal. In turn, speculators worked on impulse candles. As you can see, all approaches were profitable.
Considering the trading chart in general terms [the daily period], we see that the existing fluctuation within 1.2770 // 1.2885 // 1.3000 reflects the instability of the existing medium-term trend.
The news background of the past day contained inflation data in the United Kingdom, where growth was confirmed from 1.3% to 1.8% with a forecast of 1.4%. The reaction of the pound was so insignificant that it was practically not noticed. Then came data on producer prices in the United States, where the acceleration was from 1.3% to 2.1% with a forecast of 1.7%. At the same time, construction data came out much better than expected, and all this played into the hands of the dollar, which led to a further decrease in the GBP / USD pair.
In terms of the general informational background, we see continued noise regarding the upcoming negotiations on trade interactions after Brexit. So, French President Emmanuel Macron insists on the introduction of more stringent conditions for Britain, in the negotiation process, defending the position of the European Union. Similar actions from Macron were already noticed when they were approving the agreement, but in the end, the pressure subsided. In any case, they are now trying to stir up the background before the March talks, where new cries and negativity are still possible. Brexit has already hit British investors who, since the start of the referendum [2016], have been actively leaving the territory separating from Europe. The country, which was able to shelter running investors, was the Netherlands,
In turn, Prime Minister Boris Johnson is actively talking about the new immigration system, where people who want to get a work visa will have to get at least 70 points in a number of categories, one of them finding a job with a salary of at at least 23,000 pounds a year.

Today, in terms of the economic calendar, we have data on retail sales in Britain, where they expect a slowdown from 0.9% to 0.5%. In the afternoon, there will be data on applications for unemployment benefits in the United States, where they forecast growth in applications in the amount of 17 thousand.: Primary 10 thousand .; Repeated 7 thousand
Further development
Analyzing the current trading chart, we see a rapprochement with the minimum of February 10, where the average level of 1.2885 is located. In fact, this point of interaction of trading forces is extremely interesting for traders. The reason for such strong attention comes from the fact that consolidation below will make it possible to use the existing range in full scale, that is, the move to the lower border of 1.2770 // 1.2885 // 1.3000.
From the point of view of the emotional mood, we see that the market activity is again high, and this is understood, the quotes play again for a fall, and this is interesting for many of their prospects.
By detailing the time interval that we have per minute, we see that from the beginning of the new day the quotes continued to decline, reaching the level of 1.2885, where a local slowdown was formed.
In turn, medium-term traders are in the profit zone, but the main prospect is still ahead. Due to the risk of a rebound from the support on February 10, intraday traders take profits from short positions and analyze current behavior.
Having a general picture of actions, it is possible to assume that there is local overheating, which can lead to a rollback, but the main prospect of a downward movement remains. We consider further sales operations after consolidation below 1.2870.
Based on the above information, we derive trading recommendations as follows:
- Local purchase positions were considered in case of consolidation higher than 1.2930, towards 1.2970.
- Positions for sale are already being conducted by traders in the direction of the level of 1.2770, medium-term, the first point. Intraday is considered as for sale in case of consolidation lower than 1.2870.
Indicator analysis
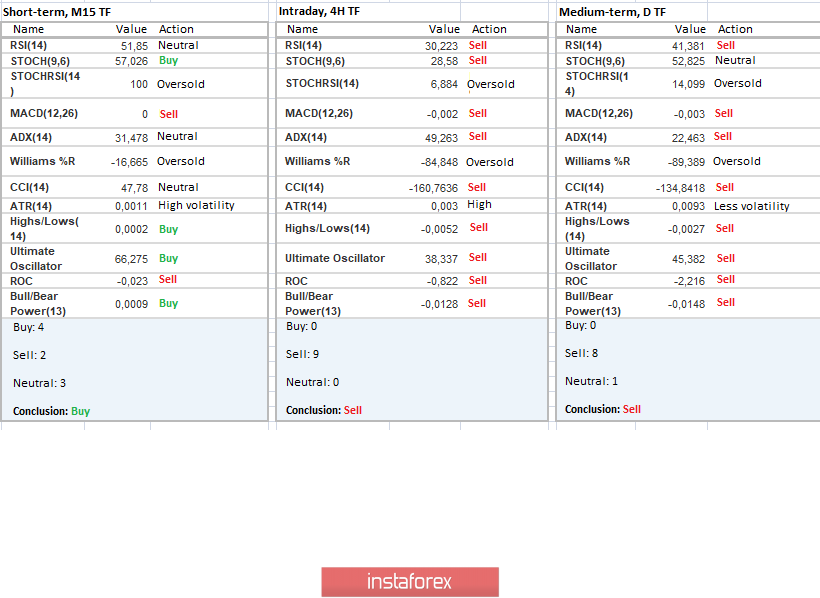
Analyzing a different sector of timeframes (TF), we see that due to the massive move, a practically uniform sell signal appeared in terms of technical tools.
Volatility per week / Measurement of volatility: Month; Quarter Year
Measurement of volatility reflects the average daily fluctuation, calculated for Month / Quarter / Year.
(February 20 was built taking into account the time of publication of the article)
The volatility of the current time is 45 points, which is still a low value for the dynamic pair GBP / USD. If the quotes still manages to overcome the level of interaction, then acceleration of volatility is provided to us.
Key levels
Resistance Zones: 1.3000; 1.3170 **; 1.3300 **; 1.3600; 1.3850; 1.4000 ***; 1.4350 **.
Support Areas: 1.2885 *; 1.2770 **; 1.2700 *; 1.2620; 1.2580 *; 1.2500 **; 1.2350 **; 1.2205 (+/- 10p.) *; 1.2150 **; 1,2000 ***; 1.1700; 1.1475 **.
* Periodic level
** Range Level
*** Psychological level
**** The article is built on the principle of conducting a transaction, with daily adjustment
InstaForex analytical reviews will make you fully aware of market trends! Being an InstaForex client, you are provided with a large number of free services for efficient trading.


