 Stay
Stay 
Trading Conditions
Products
Tools


From a comprehensive analysis, we see extremely high activity, where the inertial course can not be completed in any way. Now, about the details. Sellers' dreams are collapsing along with an unquenchable inertia move that has seriously diverged, generating more than half of the entire downward movement for February. Frankly speaking, we did not expect such a turn in development, the points of interaction where slowdowns with a rebound could have occurred were passed without extra effort. If you refer to the hourly chart, the psychological level of 1.1000 was already broken today. Is the theory of top-down development a failure? It is not necessary to jump to conclusions. The reasons for such a sharp growth are now being carefully considered, where they reduce the existing behavior to the collapse of the US stock market. There is something to think about. If you switch to the stock market, we see disastrous numbers - the S&P 500 index fell by 13% in six days, losing $ 3.5 trillion in capitalization. While the Dow Jones fell by 4.4%; Nasdaq forecast -4.6%; the yield on 10-year US Treasury bonds fell to 1.28%, while the yield on 30-year US Treasury bonds fell to 1.78%.
Everything that happened was immediately compared to the great depression, as well as to the crisis of 2008. In this situation, another point looks interesting: before this "colossal" collapse, we had such a strong growth relative to all indices that it was as if everyone completely ignored the possible risk. The conclusion is a collapse with a small rustle.
Now back to our rams, the dollar is losing ground at a lightning speed, against the background of panic developing in the stock market. Whether this is a local phenomenon is probably true, but now we need confirmation of whether the bears will be able to return to the initial phase after such a strong defeat.
In terms of volatility, we see the first significant acceleration of 127 points this year, which exceeded the daily average by 159%. Such activity can easily lead to FOMO (lost profit syndrome), which will not bring anything good to the theory of top-down development.
Analyzing the past day by the minute, we see a distinct inertial move that was set conditionally at 00:00 hours and lasted until the end of the trading day. Whether this movement is a sign of overheating of long positions is certainly true, unless there is FOMO syndrome.
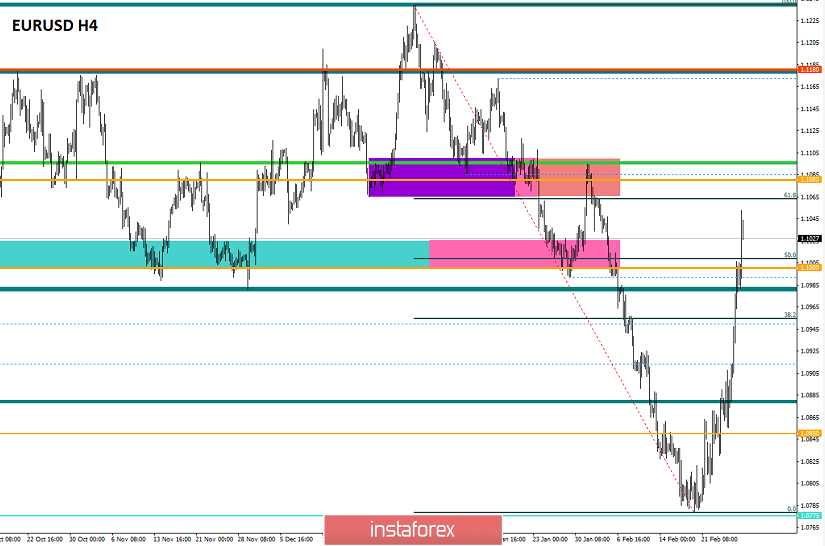
As discussed in the previous review, many traders were waiting for a reversal, referring to the point of variable resistance of 1.0950, where the Fibo level of 38.2 was located. However, the upward move remained.
The recommendation from Thursday regarding the possible resumption of the upward move coincided, with a small profit.
(Buy positions will be considered if the price is fixed higher than 1.0960, with the prospect of a move to 1.1000.)
Looking at the trading chart in general terms (the daily period), we see a return of the price to the area of the four-month oblong correction, where the quote wavered for a painfully long period earlier.
The news background of the previous day included the second preliminary estimate of the United States GDP for the fourth quarter, where economic growth was expected to accelerate to 2.3%. However, the forecasts did not match and the GDP level remained at 2.1%. At the same time, data was published on applications for unemployment benefits in the United States, where there were almost no changes -1,000 (Repeated: -9,000; Primary +8,000).
The market reaction to the statistics was somewhere in the depth of all the noise and the dollar was losing its position.
In terms of the general information background, we have news that Britain has published the mandate of the negotiating position on the future trade agreement with the European Union after Brexit. The main areas of negotiations were the topics of access to the free market, cooperation in the field of aviation, fisheries, financial services, transport and telecommunications. In the context of the "black and white" document, the British indicated that they would not accept any obligation to bring laws into line with EU law.
In turn, the European side took note of the mandate of the United Kingdom and will discuss its terms for further relations between London and Brussels on March 2.
"We have taken into account the UK mandate published today (February 27) and will discuss our respective positions on Monday. We will adhere to the priority agreements in the framework of the political declaration on the relationship of the parties. We want an ambitious and honest partnership with the UK in the future," EU chief negotiator Michel Barnier tweeted
An interesting point in the British mandate and subsequent comments was that the UK government does not rule out leaving the EU without an agreement if the main directions are not agreed by June (2020).
Now we understand that the risk of noise growth in the upcoming negotiations is extremely high and it can lead to a decline in the single currency.
Today, in terms of the economic calendar, we had preliminary data on inflation for a number of EU countries, where the expected indicators did not come out in the best light. In the second half of the day, data on income/expenses of US individuals are published, where significant changes are not expected.
The upcoming trading week is very busy in terms of the economic calendar. So, the beginning of the week is highlighted by PMI data and preliminary data on inflation in Europe. The middle of the week gives the ADP report on the level of employment, and then the report of the United States Department of Labor. And this is not all. Next week, the negotiations between England and Brussels on the Brexit agreement will start.
The most interesting events displayed below:
On Monday, March 2
EU 10:00 London time - manufacturing business activity index (PMI) (Feb): Prev 47.9 -> Forecast 47.8
USA 16:30 London time - the index of business activity in the manufacturing sector (PMI) from ISM (Feb): Prev 47.2 -> Forecast 50.2
On Tuesday, March 3
EU 11:00 London time - preliminary inflation data: Prev 1.4% -> Forecast 1.3%
On Wednesday, March 4
EU 10:00 London time - business activity index in the service sector (Feb): Prev 52.5 -> Forecast 52.8
EU 11:00 London time - retail sales (y/y) (Jan): Prev 2.4% -> Forecast 1.3%
USA 14:15 London time - ADP report on the level of employment in the private sector (Feb): Prev 291.1K -> Forecast 191K
On Thursday, March 5
USA 14:30 London time - applications for unemployment benefits
On Friday, March 6
USA 14:30 London time - report of the United States Department of Labor
Further development
Analyzing the current trading chart, we see a characteristic surge in activity, where the psychological level of 1.1000 was passed with the start of the European session. In fact, the same background of panic that came to us from the West, paired with the FOMO syndrome, leads to further growth, although overbought has already reached its limit. The risk of a reversal is extremely high, and it is worth taking this into account in your analysis.
Detailing the available time interval every minute, we see that the round of rising candles appeared at 10:00 and we had a narrow flat of 1.0980/1.1005 before the jump.
In turn, intraday traders are now either in further long positions directed towards the next level of 1.1080 or out of the market altogether, which is also good. Speculators work on jumps on the market.
It is likely to assume that a technical correction relative to this entire upward rally should occur, so you can try to make money on it. Regarding the theory of downward development, we will return to this topic again after fixing the price below 1.0980.
Based on the above information, we will output trading recommendations:
- Buy positions can be considered higher than 1.1065 with a move to 1.1080 and the risk is high due to overheating.
- Positions for sale in the form of a technical correction are considered relative to the available values in the direction of 1.1000.
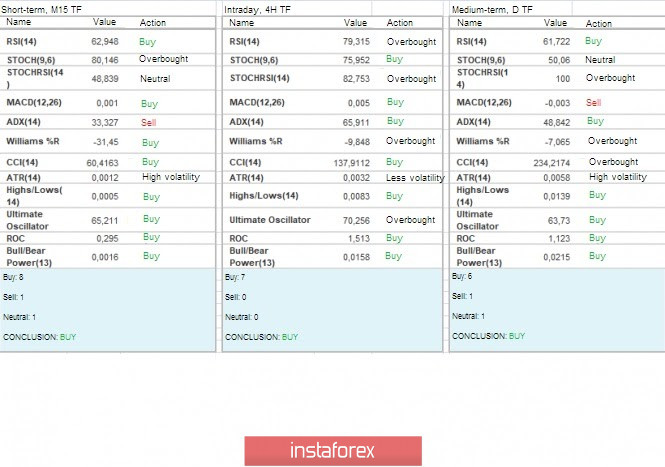
Indicator analysis
Analyzing different sectors of timeframes (TF), we see that the indicators of technical instruments unanimously signal purchases due to the existing rally. It is worth taking into account that during the technical correction, the indicators on the minute and hour periods will quickly change their values.
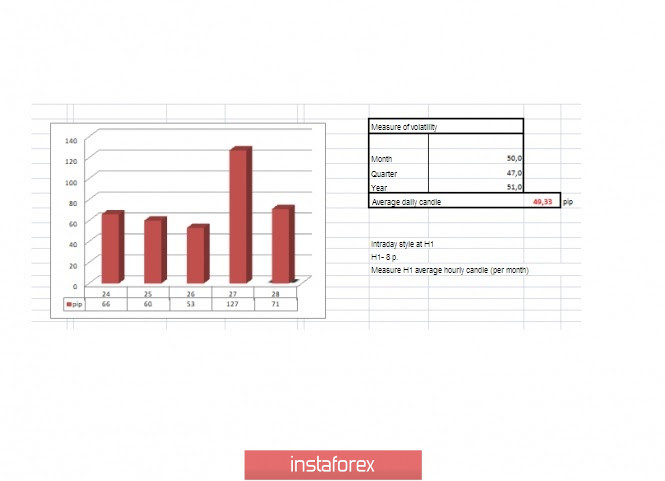
Volatility for the week / Volatility Measurement: Month; Quarter; Year.
The volatility measurement reflects the average daily fluctuation from the calculation for the Month / Quarter / Year.
(February 28 was based on the time of publication of the article)
The current time volatility is 71 points, which is already 44% higher than the daily average. It is likely to assume that if the noise and FOMO persist, volatility may increase.
Key levels
Resistance zones: 1.0950**; 1.1000***; 1.1080**; 1.1180; 1.1300**; 1.1450; 1.1550; 1.1650*; 1.1720**; 1.1850**; 1.2100.
Support zones: 1.0850**; 1.0775*; 1.0700; 1.0500***; 1.0350**; 1.0000***.
* Periodic level
** Range level
*** Psychological level
***** The article is based on the principle of conducting a transaction, with daily adjustments.
InstaForex analytical reviews will make you fully aware of market trends! Being an InstaForex client, you are provided with a large number of free services for efficient trading.

