 Stay
Stay 
Trading Conditions
Products
Tools


EUR/USD
At the meeting on Thursday, the ECB kept all three rates (base 0.0%, deposit rate -0.5%, lending 0.25%), but introduced a "stabilization package" of 120 billion euros for the purchase of corporate bonds. The ECB lowered its economic forecast for the current year to 0.8% from 1.1% in the previous estimate. Investors continued to buy the safe-haven currency, the dollar. The euro closed the day down by 93 points. Donald Trump's ban on tourists from Europe entering the United States will come into effect starting today.
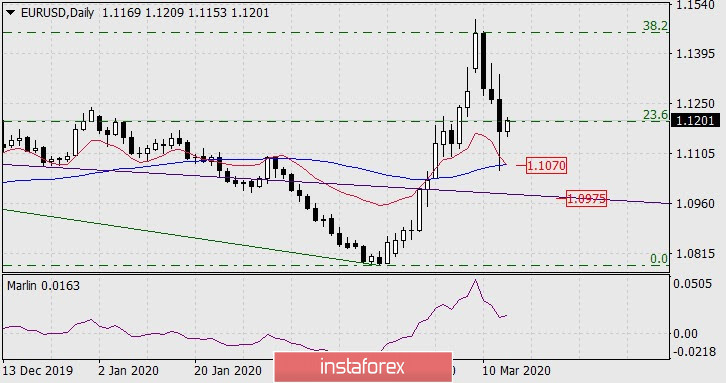
On the daily chart, the euro's fall was met with support for the MACD line. The price is testing the resistance of the Fibonacci level of 23.6% at the moment. And since important data will not be released today, the price may spend the entire session near this level. The signal to continue the decline, with the euro's intention to work out the support of the embedded line of the price channel in the area of 1.0975 and even the lower line at 1.0640, will be the departure of the price under the daily MACD line (1.1070).
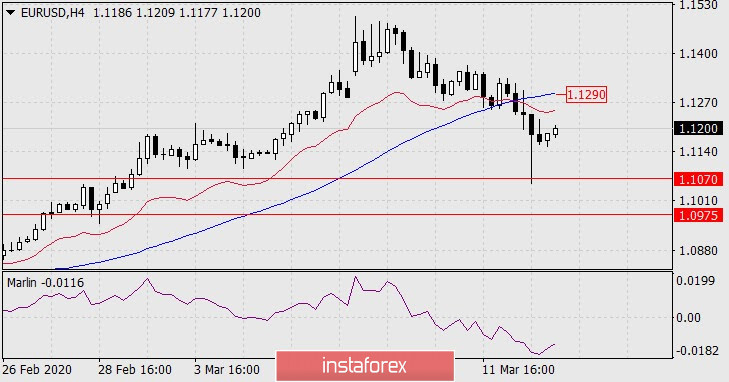
The price is fixed under the MACD and balance indicator lines on the four-hour scale chart. The signal line of the Marlin oscillator unfolds from the oversold zone, which indirectly confirms the intention of the price to form a more pronounced correction from the fall of the last three days. The top of the correction may be at the MACD line at the price of 1.1290.
InstaForex analytical reviews will make you fully aware of market trends! Being an InstaForex client, you are provided with a large number of free services for efficient trading.


