 Stay
Stay 
Trading Conditions
Products
Tools


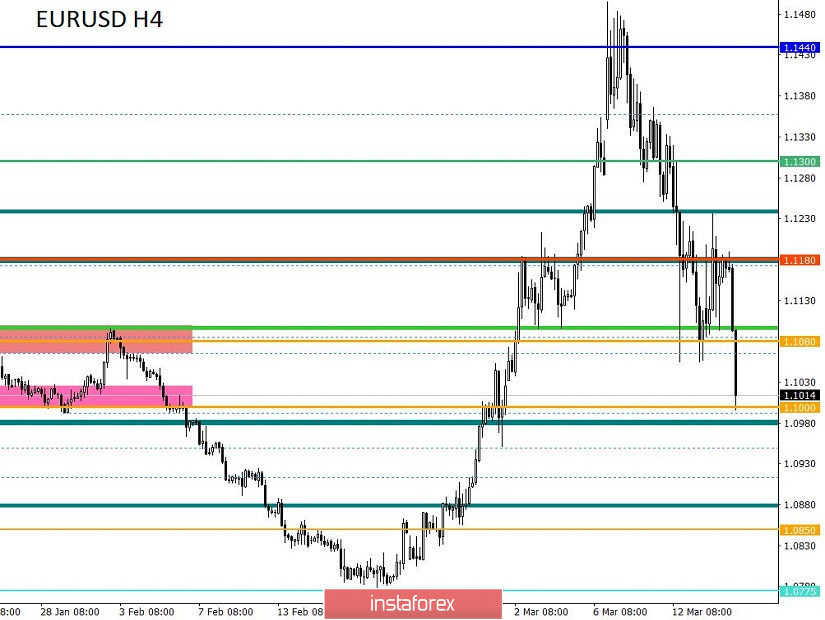
From the point of view of complex analysis, we see a wide range of fluctuations between the two price levels, and now let's talk about the details. The downward movement set last week led the quote to the area of the level of 1.1080, where the support point was found. In fact, the quote allocated another coordinate for itself in the face of the level of 1.1180, after which we received a conditionally looped movement of honey between two levels – 1.1080 / 1.1180. It is worth noting that the existing movement within the conditional range has a value of more than 60 hours, which, relative to the number of border developments, suggests that the oscillation framework is already unstable.
The medium-term downward trend theory is gaining momentum again, and the external background helps, which scares investors and provokes the market to high activity. In fact, the chance of a decline back to the region of 1.0900 and lower with this instability and panic in Europe is more possible than ever.
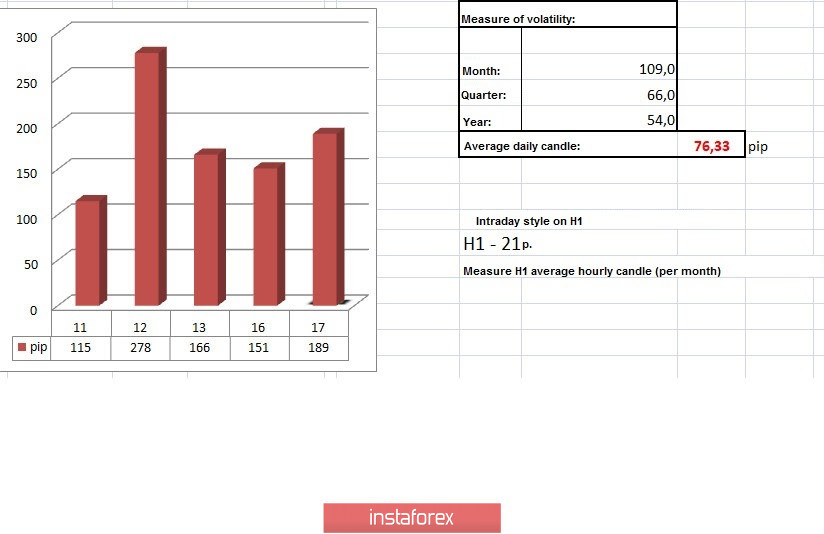
Regarding volatility, we record acceleration on a daily basis, where the daily average indicator has grown by 34% since the beginning of the year, and the average weekly candlestick on a daily basis exceeds 100 points, which indicates a panic in the market.
Details of volatility: Monday - 155 points; Tuesday - 183 points; Wednesday - 115 points; Thursday - 278 points; Friday - 166 points; Monday - 151 points. The average daily indicator, relative to the dynamics of volatility is 67 points [see table of volatility at the end of the article].
Analyzing the past minute, we see a sharp increase in activity that occurred both at the opening of the market and during the European session. The market dynamics was so high that local surges reached +100 points.
As discussed in a previous review, speculators are working, where, as expected, the fourth market tact led to a decrease.
Considering the trading chart in general terms [the daily period], we see a recovery with respect to the upward inertia, where the quote worked for more than 60%, which means that there is a chance to resume the initial trend.
The news background of the past day does not have the attention of statistics on Europe and the United States, but they are not needed when there is such a wide external background.
In terms of a general informational background, the first thing we encountered was the actions of the Federal Reserve System [FRS], which lowered the refinancing rate to 0.25% within the framework of an emergency meeting once again. The main stimulus for such drastic actions is the worsening spread of the coronavirus, which sets new records every day. Investors are panicking, and US President Donald Trump is making everything worse, who no longer denies that the outbreak of the virus could drag on until July-August, but it could go on. This kind of statement from the head of the White House stepped up Wall Street bookkeepers, who immediately calculated the possible losses from the protracted pandemic, and the financial markets turned red again.
Moreover, panic rises not only in the States, but also in Europe, where the epicenter of the coronavirus is now. According to the data from 03/17/2020 at 5:00 [Universal time], only 182,178 cases of the disease were recorded in the world, an increase of 12,761 per day. Italy continues to be the leader of the epicenter, where 27,980 infected people have already been recorded, followed by Spain [9942]; Germany [7272]; France [6653] Switzerland [2330]. The rapid growth of infections leads to drastic action on the part of EU leaders, where the closure of borders and martial law is already a conditional fact.
Against such a terrible background, the head of the Austrian National Bank, Robert Holzmann, said that if the ECB sees the need for further stimulation in the government bond segment to help countries cope with the influence of coronavirus, the regulator is ready to do so.
On the same day, the head of the Bank of England reminded that he was ready, in the event of what and further, to act promptly as necessary in connection with the growing risk of coronavirus.
As we can see from all the above, the world is in the midst of panic, it all affects the global economy, and also provokes high activity in the financial markets.
Today, in terms of the economic calendar, we have data on retail sales in the United States, where a slowdown is expected from 4.4% to 2.7%. Indicators for US industrial production will come out a little later, where the rate of decline should slow down from -0.8% to -0.3%.

Further development
Analyzing the current trading chart, we see that the lower border of the 60 hour range of 1.1080 / 1.1180 declined under the attack of sellers, where an impulsive spire was formed, which led us to the psychological level of 1.1000. Activity surpasses, and speculators will not stop there, since everything that happens is very similar to inertia, which does not notice the fact of overselling or technically important levels on the way. Thus, further recovery, and as a fact, the return of prices to the base of 1.0775, is like a prospect for the future.
In terms of emotional mood, we have already repeatedly mentioned the panic that provokes the actions of speculators.
By detailing the available time interval, we see that the start of the European session is the beginning of a downward inertia, which managed to lower the quote by more than 170 points in a matter of hours.
In turn, traders are actively working to lower, where recent positions were opened at the time of the breakdown of the level of 1.0080.
It is likely to assume that such high activity and price fixing lower than 1.1000 may lead to a further decline in the direction of 1.0900-1.0850-1.0775. With such tremendous activity, this can take only a few days while maintaining the proper panic mood, which is more than enough now.
Based on the above information, we derive the following trading recommendations:
- Buy positions should be considered with local correction / rollback, a possible point is the level of 1.1000 in case of finding a support. In this case, it is better not to rush and analyze this moment at shorter periods to catch the rebound.
- Sales positions are already being held by traders, and the point for partial fixation may be the level of 1.1000. If the price manages to fix below the psychological level and the mood persists, then we keep it to the last, that is, to the points 1.0900-1.0850-1.0775.
Indicator analysis
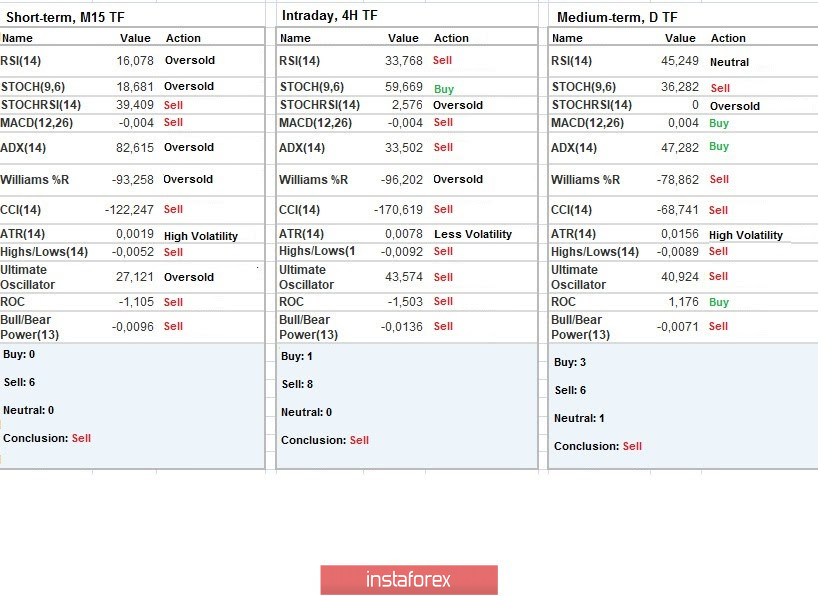
Analyzing a different sector of timeframes (TF), we see that the indicators of technical instruments relative to all periods occupy a sell position due to a massive downward move.
Volatility per week / Measurement of volatility: Month; Quarter; Year
Measurement of volatility reflects the average daily fluctuation calculated from Month / Quarter / Year.
(March 17 was built taking into account the time of publication of the article)
The current time volatility is 189 points, which already exceeds the average daily indicator by 148%. It is likely to assume that panic will continue to whip up activity in a market where, hypothetically, volatility could rise further.
Key levels
Resistance Zones: 1.1180; 1.1300; 1.1440; 1.1550; 1.1650 *; 1.1720 **; 1.1850 **; 1.2100
Support Areas: 1,1080 **; 1.1000 ***; 1.0950 **; 1.0850 **; 1.0775 *; 1.0700; 1,0500 ***; 1.0350 **; 1.0000 ***.
* Periodic level
** Range Level
*** Psychological level
***** The article is built on the principle of conducting a transaction, with daily adjustment
InstaForex analytical reviews will make you fully aware of market trends! Being an InstaForex client, you are provided with a large number of free services for efficient trading.

