 Stay
Stay 
Trading Conditions
Products
Tools


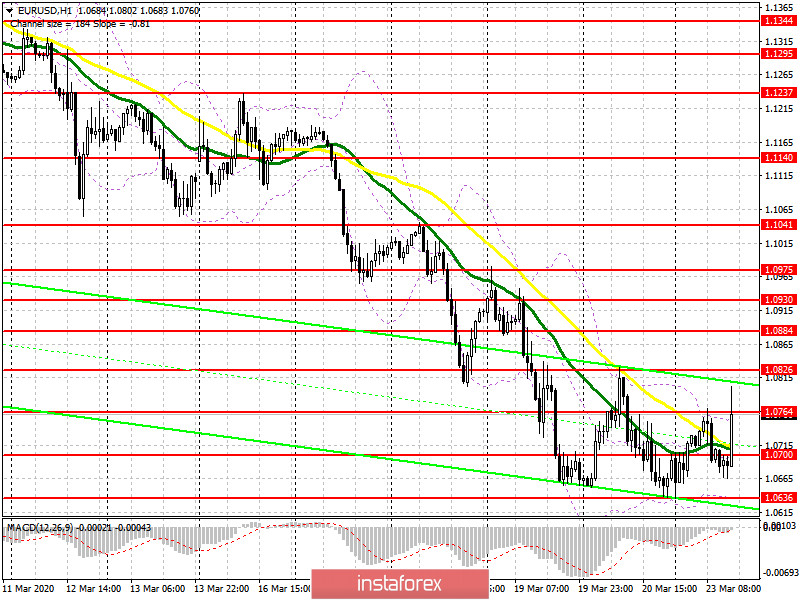
To open long positions on EUR/USD:
The euro rose amid the news that the Fed would print as much money as needed and without any restrictions. The information that the Fed is likely to purchase unlimited amounts of bonds has put pressure on the US dollar. However, the demand for the dollar continues. Euro buyers are better to focus on the resistance level of 1.0764. If the price breaks through this level and consolidates above it, the pair can increase to the high of 1.0826, where it is preferable to take profit. If the pressure on the euro continues, it is better to open long positions when the price falls to the year's low of 1.0636 and a false breakdown is formed. Also, it is preferable to buy the euro on the rebound from the support levels of 1.0572 and 1.0527, counting on a correction of 30-40 pips within a day.
To open short positions on EUR/USD:
The sellers continue to put pressure on the euro. If not for the Fed's announcement, the pair would consolidate below the level of 1.0700. If the pair retraces under this level, it can lead to further sell-off of the EUR/USD to the year's low of 1.0636. Then, the price can fall to the levels of 1.0572 and 1.0527, where it is preferable to take profit. No fundamental statistics will be published in the second half of the day. Under these circumstances, if the pair consolidates above the resistance level of 1.0764, this can be the first indicator that it is time to open short positions. Otherwise, the price can rebound from the resistance level of 1.0826 and 1.0884.
Indicator signals:
Moving averages
Trading is at 30 and 50 moving averages, which indicates the intraday struggle of buyers and sellers for the short-term market direction.
Bollinger Bands
If the price breaks through the upper border of the indicator at 1.0764, it can lead to an upward correction, while a break through the lower border of the indicator at 1.0636 is likely to increase pressure on the euro.
Description of indicators
InstaForex analytical reviews will make you fully aware of market trends! Being an InstaForex client, you are provided with a large number of free services for efficient trading.

