 Stay
Stay 
Trading Conditions
Products
Tools


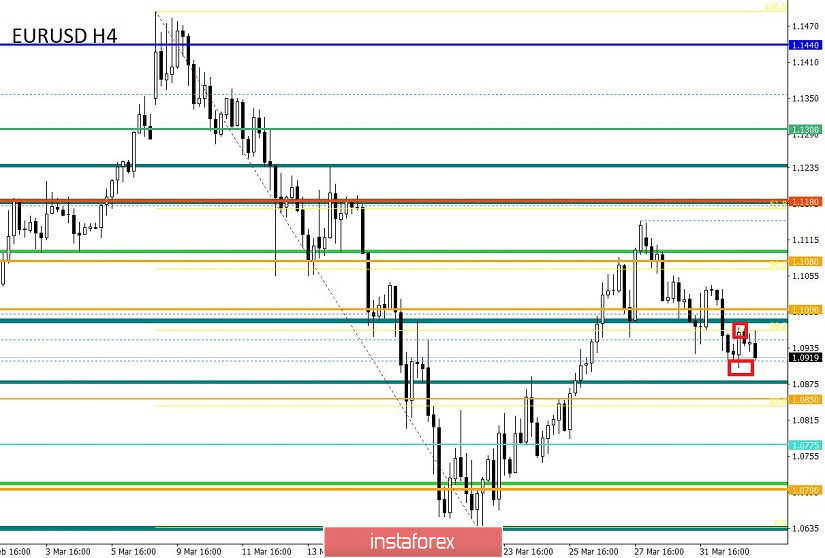
From the point of view of complex analysis, we see a downward formation, where the quote has locally approached the level of 1.0900, and now let's talk about the details. The quote updates its daily lows slightly for the third day in a row, but during which it manages to form a partial recovery relative to the upward trend of last week. It is difficult to say whether there is another round of inertia now in a downward direction, since the level of 1.0900 is still not broken by the price, and the external background, paired with the statistical data, does not quite lead to a local strengthening of the dollar. It is possible to consider the movement as corrective, but do not forget that we have almost constantly recorded inertial moves since the beginning of 2020, and if we make a reference to the regularity of the past, then the current movement has grounds for future downward inertia.
Based on this pattern, traders cling to the "Head and Shoulders" graphic pattern, which has a clear outline in the hourly period, where a breakdown of the neck level is currently taking place. It is not worth making hasty conclusions, since the external background rules the ball now, and with the slightest advantage of the trading forces with the supply of the background, the upward move may resume. For this reason, we did not fly into the market at current values yesterday and took a waiting position with pending orders to clarify the circumstances.
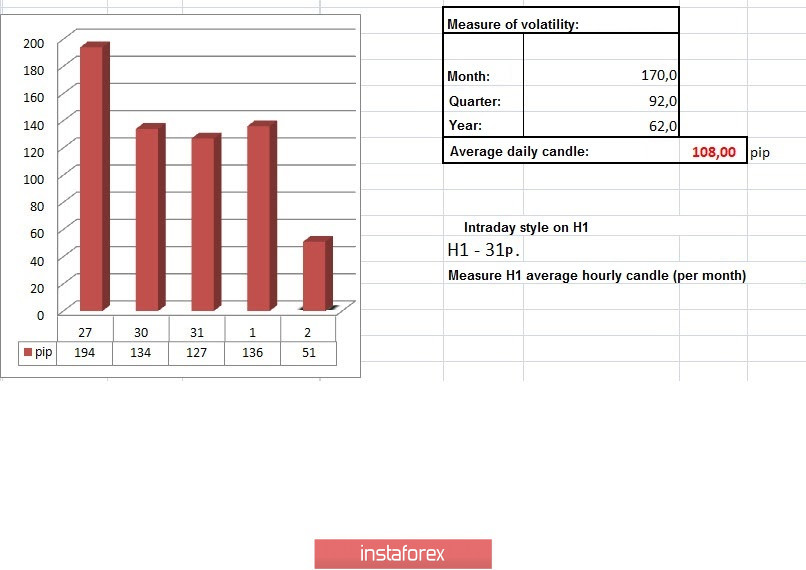
Regarding volatility, we see that the current week still reflects the acceleration process relative to the average daily indicator, although there are clear signs of a slowdown in comparison with the past weeks. It is worthwhile to understand that there can't be an eternal rally and the market is gradually adapting, thereby leaving you less and less time until the onset of the everyday activity of the single currency.
Let me remind you that the activity of the euro / dollar pair was 60–80 point before its exposure to an external background.
Details of volatility: Monday - 155 points; Tuesday - 183 points; Wednesday - 115 points; Thursday - 278 points; Friday - 166 points; Monday - 151 points; Tuesday - 234 points; Wednesday - 243 points; Thursday - 326 points; Friday - 194 points; Monday - 191 points; Tuesday - 160 points; Wednesday - 133 points; Thursday - 188 points; Friday - 194 points; Monday - 134 points; Tuesday - 127 points; Wednesday - 136 points. The average daily indicator, relative to the dynamics of volatility is 108 points [see table of volatility at the end of the article].
Analyzing the past day, we see that the main round of short positions fell at the start of the European session and lasted until noon. The subsequent movement was residual, which led the quote to the area of 1.0900 and there was a rebound.
As discussed in the previous review, traders considered two main coordinates 1.0900 - 1.1050, which were never broken by price.
Considering the trading chart in general terms [the daily period], we see a Zigzag-like fluctuation, only on the scale of inertia, which indicates a kind of panic in the market and increased speculative activity.
The news background of the past day contained data on the unemployment rate in the eurozone, where they recorded a decrease from 7.4% to 7.3%, but it is worth considering that the figure is for February, which means that everything is still ahead. In the afternoon, they published an ADP report on the labor market in the United States, where they expected terrible collapses in employment by 150 - 170 thousand. As a result, a decrease occurred, but the forecast did not coincide with the fact, a decrease of 27 thousand. There was no market reaction to statistics, as if all froze, and most importantly, the dollar did not enter the phase of a sharp loss of position. Let me remind you that we see negative employment data for the first time since 2017.
In terms of the general informational background, we see that there are signs that the epidemiological situation and the spread of COVID-19 in Europe may soon decline. Such a judgment is based on indicators for Italy, where the mortality rate, as well as the growth of new infections, is declining. At the same time, Spain still maintains the characteristic anti-record for deaths, but in Germany, the Netherlands, Switzerland and other EU countries, the pace of spread is slower.
The epicenter of coronavirus is now the United States, where a characteristic peak of infection is expected in the next two weeks.
"We are waiting for a very difficult two weeks, and then, I hope we will see the light at the end of the tunnel, as experts predict. But it will be two very painful weeks." said Donald Trump at a briefing [04/01/20].
Today, in terms of the economic calendar, the market is shocked again in the form of applications for unemployment benefits in the United States, where a characteristic anti-record was already set last week, but that did not end there. A new week and a new flow of unemployed, where initial applications can be 3,180,000, and the number of repeated applications can reach 4,920,000.
Now, the main question is will the secondary shock from the performance of applications put pressure on the US dollar again? Perhaps, this has its justification in the form of high indicators, but the market has already seen highs and is ready for them, thereby the reaction may not be so intense.
Further development
Analyzing the current trading chart, we see a characteristic slowdown within 1.0930 / 1.0970, which is a local phenomenon and we will be faced with a breakdown of variable frames soon. In fact, this can be a turning point, but again in local consideration. It is worth considering that the support remains in the form of the level of 1.0900.
In terms of the emotional background, we see a characteristic pressure on market participants, which is used by speculators, and any background can now be regarded as a new round of impulse.
In turn, traders are waiting for the most suitable moment to enter, where positions for sale will be considered after fixing the price lower than 1.0900, but for the purchase, they are considered relative to the upper boundary of the variable deceleration of 1.0930 / 1.0970 .
It can be assumed that the fluctuation within the boundaries of 1.0930 / 1.0970 will not last long, where it is worth being prepared for a surge. As you understand, we will work on the breakdown of variable deceleration, as well as on the breakdown of the main level, that is, the level of 1.0900. At the same time, if you make a reference to the regularity of the last week, then applications for benefits in the United States can exert local pressure on the dollar, thereby working on both raising and lowering.
Based on the above information, we derive trading recommendations:
- We consider buying positions in case of fixing higher than 1.0970, with the prospect of a movement to 1.1030-1.1080.
- We consider selling positions in case of price fixing lower than 1.0900, with the prospect of a movement to 1.0850-1.0775.
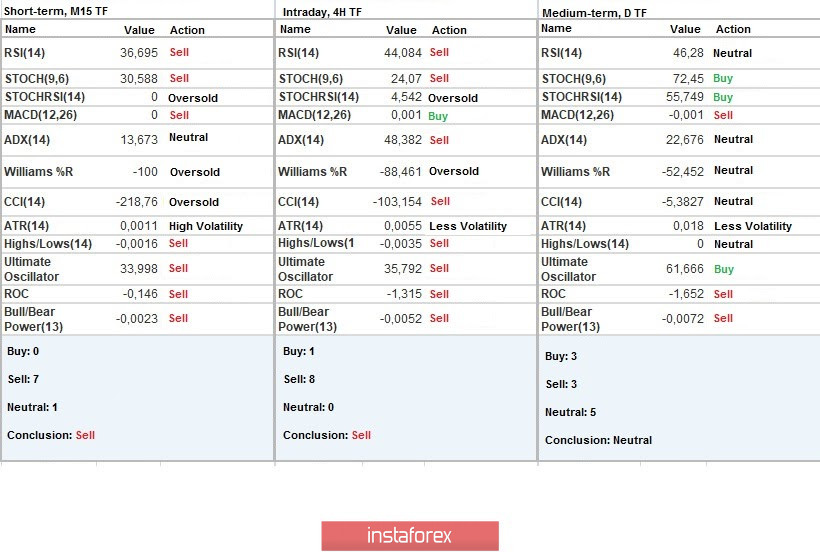
Indicator analysis
Analyzing a different sector of time frames (TF), we see that the minute and hour periods save the signal about the sale due to the downward spiral. The most remarkable point was that the daily periods replaced the rising interest in the neutral.
Volatility per week / Measurement of volatility: Month; Quarter; Year
Measurement of volatility reflects the average daily fluctuation calculated from Month / Quarter / Year.
(April 2 was built taking into account the time of publication of the article)
The current time volatility is 51 points, which is still considered a small indicator, but we are still in the stagnation stage. It is likely to assume that acceleration will occur as soon as stagnation and conditional frameworks decline. The stimulus for acceleration will serve as an external background again, paired with statistical data.
Key levels
Resistance zones: 1.1000 ***; 1.1080 **; 1,1180; 1.1300; 1.1440; 1.1550; 1.1650 *; 1.1720 **; 1.1850 **; 1,2100
Support areas: 1.0850 **; 1.0775 *; 1.0650 (1.0636); 1,0500 ***; 1.0350 **; 1,0000 ***.
* Periodic level
** Range Level
*** Psychological level
InstaForex analytical reviews will make you fully aware of market trends! Being an InstaForex client, you are provided with a large number of free services for efficient trading.

