 Stay
Stay 
Trading Conditions
Products
Tools


To open long positions on GBPUSD, you need:
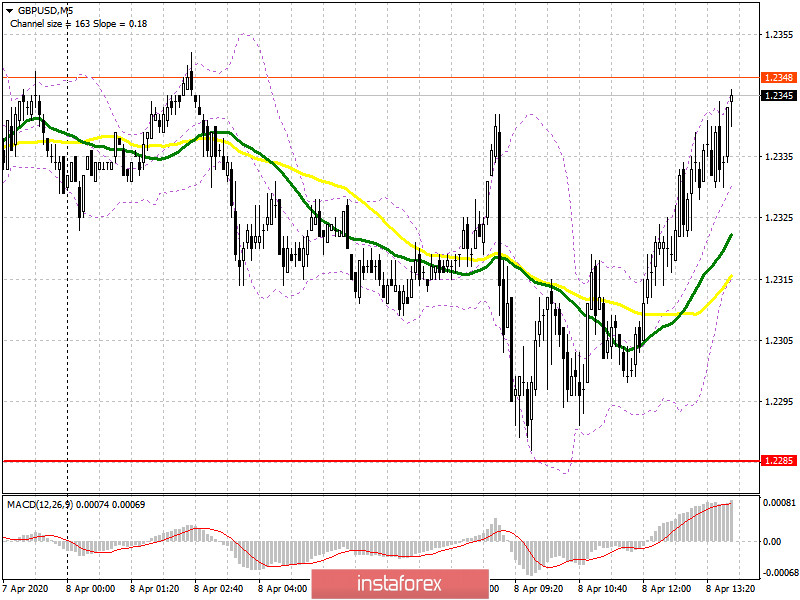
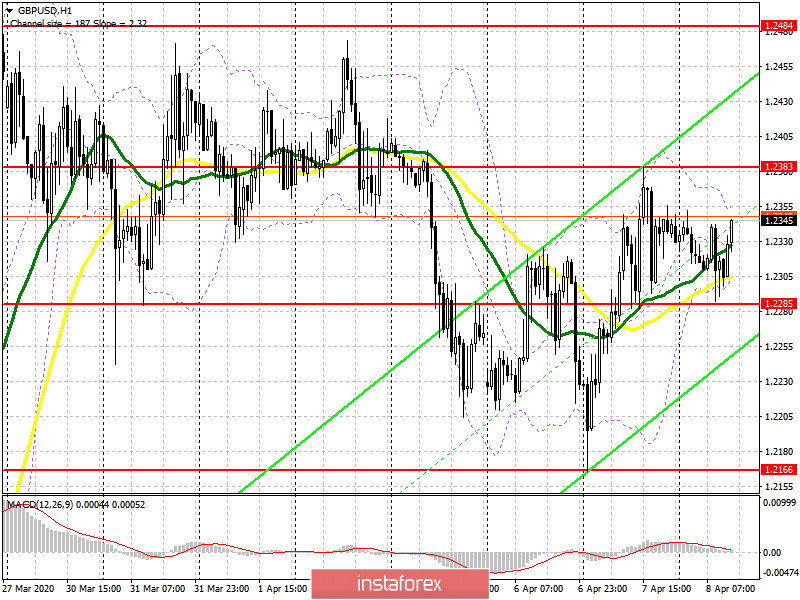
In the morning forecast, I paid attention to the reports of Commitment of Traders, which clearly showed that many players prefer to stay on the sidelines and not trade the British pound in the current conditions. This is confirmed by a sharp decrease in volatility and the formation of another side channel in the GBP/USD pair, from which it can not get out for the second week. Given that important fundamental statistics on the British pound are not expected today, it is likely that volatility will continue to fall. In the first half of the day, the bulls managed to protect the support of 1.2285, which is clearly visible on the 5-minute chart, which led to an upward correction, which tends to the upper border of the side channel of 1.2383. Only a break in this range will lead GBP/USD to a larger upward trend and last week's maximum in the area of 1.2484, where I recommend fixing the profits. If the bears again return the pair to the support of 1.2285, it is best to open long positions from there only after the formation of a false breakout, and I recommend buying GBP/USD for a rebound from the larger minimum of 1.2166 in the calculation of correction of 50-60 points within the day.
To open short positions on GBPUSD, you need:
Sellers of the pound need to try to return the market under their control and to do this, it is necessary to consolidate below the support of 1.2285, which was not possible to do in the first half of the day. A break of this level will lead to a larger sale of GBP/USD in the area of the lows of 1.2166 and 1.2030, where I recommend fixing the profits. If the bears remain in readiness mode and do not show any activity at the low of 1.2285, it is best to postpone short positions until the formation of a false breakout in the resistance area of 1.2383, which will be the first signal to sell the pound. Otherwise, it is best to shorten the market from the high of 1.2484, which is a large level of last week or to rebound from the new resistance of 1.2605.
Signals of indicators:
Moving averages
Trading is conducted in the area of 30 and 50 daily averages, which indicates the lateral nature of the market.
Note: The period and prices of moving averages are considered by the author on the hourly chart H1 and differ from the general definition of the classic daily moving averages on the daily chart D1.
Bollinger Bands
Volatility has decreased significantly, which does not give signals for entering the market.
Description of indicators
InstaForex analytical reviews will make you fully aware of market trends! Being an InstaForex client, you are provided with a large number of free services for efficient trading.

