 Stay
Stay 
Trading Conditions
Products
Tools


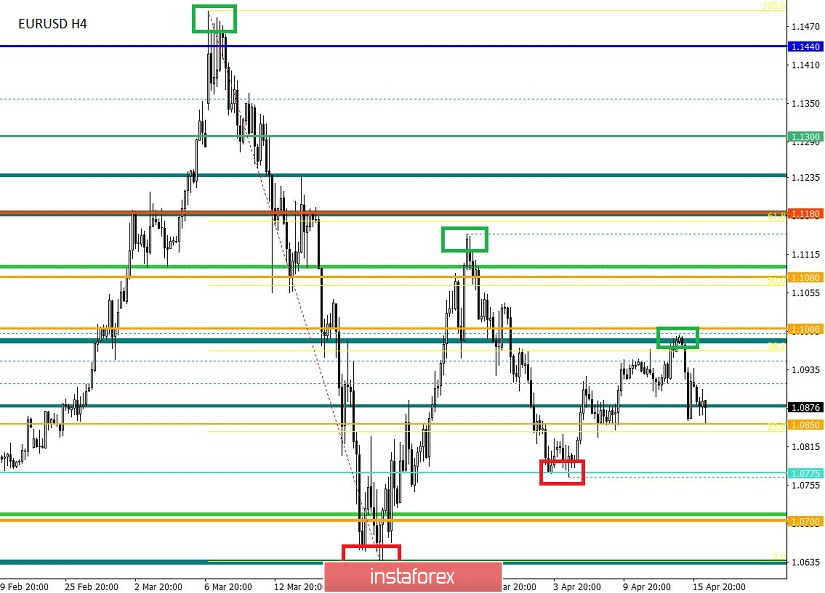
From a complex analysis perspective, we see an intense downward movement, where the quotes almost managed to reach the control level on the first try. On April 7, there was a gradual upward trend but the pair still managed to bring the quotes closer to the area of the psychological level of 1.1000, where there was a slowdown followed by a rebound. There was a price reversal in the local review where in a matter of hours, speculators managed to return the quotes to the area of a variable level of 1.0850.
Using the theory of successive oscillations, a partial confirmation of the assumptions voiced in the previous review is recorded. So it was a sequential compression of inertial oscillations, where each cycle will be worked out by 50-60% with the next cycle. And now we have inertia, which has developed the previous [03/30/20 - 04/06/20] by 60%, almost hitting the level of 1.0850.
Developing an existing theory, this time we will talk about key levels of interaction between trading forces, where after their fracture acceleration may occur, the compression model will be minimized.
So what are these levels of interaction, everything is quite simple, considering successive inertial fluctuations on the daily chart, we see the maximums and minimums of these movements, these are the points of interaction of trading forces.
The compression structure has two directions, along the trend and against it, where the release of energy does not necessarily occur in the main direction.
The number of interaction levels depends on the number of ticks. In our case, the alignment is 3 points of ascending and 2 descending:
UP
1,1000 (1,0990)
1.1150 (1.1147)
1.1500 (1.1495)
Down
1,0768
1,0636
Knowing the exact location of the coordinates, we will be ready for possible acceleration after passing one or another point of interaction of trade forces.
To avoid confusion and misunderstanding of the described theory, I advise you to read the previous article.
In terms of volatility, we recorded the highest activity in the last five trading days, where the acceleration was 31%, relative to the medium-term indicator.
Details of volatility: Monday - 155 points; Tuesday - 183 points; Wednesday - 115 points; Thursday - 278 points; Friday - 166 points; Monday - 151 points; Tuesday - 234 points; Wednesday - 243 points; Thursday - 326 points; Friday - 194 points; Monday - 191 points; Tuesday - 160 points; Wednesday - 133 points; Thursday - 188 points; Friday - 194 points; Monday - 134 points; Tuesday - 127 points; Wednesday - 136 points; Thursday - 147 points; Friday - 91 points; Monday - 67 points; Tuesday - 142 points; Wednesday - 72 points; Thursday - 110 points; Friday - 33 points; Monday - 74 points; Tuesday - 84 points; Wednesday - 134 points. The average daily indicator, relative to the dynamics of volatility is 102 points [see table of volatility at the end of the article].
As discussed in the previous review, we considered two strategies at once: the first reflected a piece of the above theory, which helped to earn on a downward movement; the second strategy was based on fundamental analysis, relying on statistics.
The news background of the past day contained data on inflation in several European countries. In Italy, there was a recorded decrease from 0.3% to 0.1%, Spain, on the other hand, had it worse, the report showed a decrease from 0.7% to 0.00%. In France, the slowdown was slightly less than the forecast, from 1.4% up to 0.7.
The reaction of the market was in terms of weakening the single currency.
In the afternoon, the published data on retail sales in the United States came where the March figures were terrible. They predicted a decline of -2.0%, as a result, the decrease was -6.2% in annual terms. Meanwhile, the published data on industrial production in the United States again showed a decline of -5.5% with a forecast of -1.5%
The reaction of the market to macroeconomic statistics was extremely surprising, but this is not the first time that the market goes across the fundamental analysis. The dollar continued to strengthen at the time of publication, and only after some time started to decline, it was all like a technical factor in the recovery of the euro after a sharp descent.
Investors are well aware that the consequences of the COVID-19 virus will affect not only the United States, but also other countries, thus, in view of the general panic, they are trying to preserve their capital in a protective asset, and this is already a dollar.
In terms of the general information background, we see a new anti-record set by the COVID-19 virus, where more than 2 million cases of infection in the world have already been registered.
The rates of coronavirus infected people continue to grow, and the effects on the economy gradually appear, and so, in the Fed's Beige Book published yesterday, economic activity has plummeted due to a global pandemic.
"Economic activity has plummeted across the US as a result of the COVID-19 pandemic. Due to social distancing and forced closure, the most affected areas are leisure, hotel business and retail, which does not include essential goods, "the document says.
At the same time, the head of the Federal Reserve Bank [FRB] of San Francisco, Mary Daily, in an interview with The Wall Street Journal said that a quick recovery of the US economy should not be expected, confirming the words of other heads of the department.
"I do not expect a sharp V-shaped recovery, I think that growth will be negative during 2020, a gradual return to positive growth is possible only in 2021," said Mary Daily

Today, in terms of the economic calendar, data on industrial production in Europe have already been released, the decline was from 1.7% to 1.9%.
In the afternoon, we are waiting for another shock on the labor market in the United States, where they will publish data on applications for unemployment benefits. So, there may be 4,720,000 initial applications, but 10,500,000 of which already repeated and that is a new record.
How the market will react to all of this is not yet clear, since investors go across the fundamental analysis and evaluate the situation in the world in general terms.
Let me remind you that we have not once recorded very poor performance in the United States, and at that time the dollar was growing in price, panic, what else to say.
Further development
Analyzing the current trading chart, we see the focus within the level of 1.0850, where in the end, a variable range of 1.0850 / 1.0900 was formed. In fact, the downward trend is still preserved in the market, and the accumulation that we are witnessing at the current time confirms this. Should we expect a further descent, why not, but at the same time the development of the quotes needs to be firmly fixed below the level of 1.0850, otherwise the chatter can drag on.
Regarding the emotional component of the market, we see a high level of speculative operations ratio.
It can be assumed that the fluctuation in the range of 1.0850 / 1.0900 does not last long and you should be prepared for further acceleration. Trading strategies selected by the method of the breakdown of established boundaries, with the entrance to local operations. At the same time, if the compression theory continues to form subsequent measures, then just the slowdown that we have now may reflect a new compression measure.
Based on the above information, we derive trading recommendations:
- Consider buying positions higher than 1.0905 with the prospect of a move to 1.0930.
- Consider selling positions lower than 1.0850 with the prospect of a move to 1.0800-1.0775.
Indicator analysis
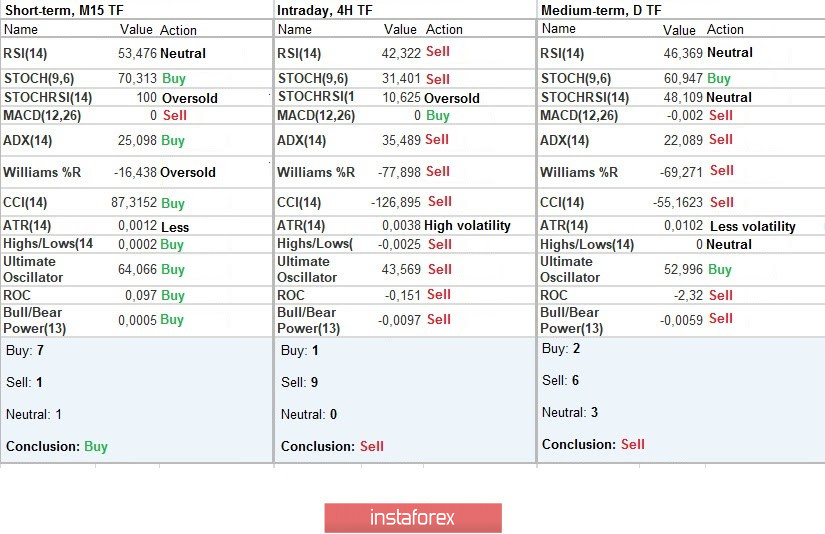
Analyzing a different sector of timeframes (TF), we see that indicators of technical instruments on hourly and daily periods signal a sale due to a rapid downward movement a period earlier. The minute intervals of the accumulation signal reflect a variable signal.
Volatility per week / Measurement of volatility: Month; Quarter year
Volatility measurement reflects the average daily fluctuation calculated for the Month / Quarter / Year.
(April 16 was built taking into account the time of publication of the article)
The volatility of the current time is 58 points, which is 43% lower than the daily average. It can be assumed that activity may increase in the event of a breakdown of the framework with accumulation.

Key levels
Resistance zones: 1,1000 ***; 1.1080 **; 1,1180; 1.1300; 1.1440; 1.1550; 1.1650 *; 1.1720 **; 1.1850 **; 1,2100
Support areas: 1.0850 **; 1.0775 *; 1.0650 (1.0636); 1,0500 ***; 1.0350 **; 1,0000 ***.
* Periodic level
** Range Level
*** Psychological leve
InstaForex analytical reviews will make you fully aware of market trends! Being an InstaForex client, you are provided with a large number of free services for efficient trading.


