 Stay
Stay 
Trading Conditions
Products
Tools


To open long positions on GBPUSD, you need:
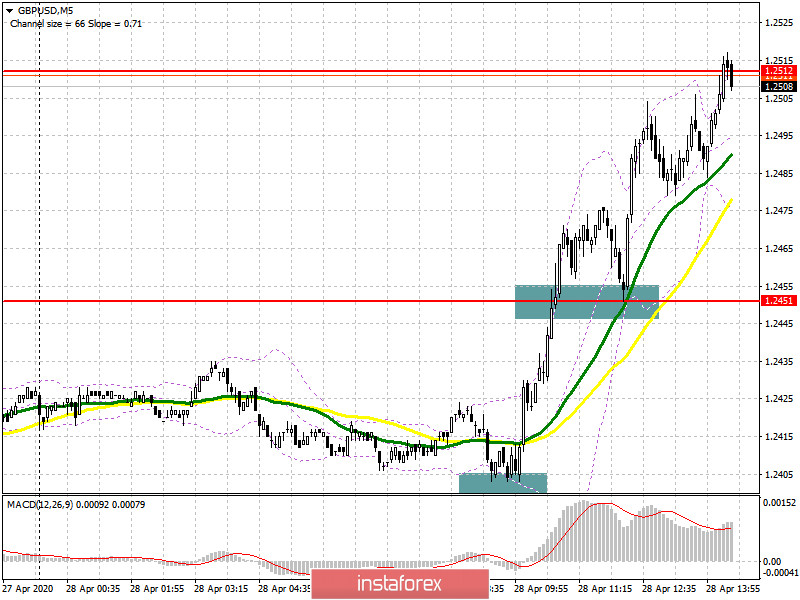
In the first half of the day, I paid attention to the probability of forming a false breakout from the level of 1.2399, but, unfortunately, a couple of points were not enough for this, and the 5-minute chart clearly shows how the bulls did not allow testing this range, starting an upward movement slightly higher, from the level of 1.2403. However, those who were more attentive and read my morning forecast could notice a breakout and consolidation above the resistance level of 1.2451, the test of which from the top-down became an additional signal to open long positions further down the trend. As a result, the bulls reached the level of 1.2512, where profit-taking is now observed. It is best to talk about purchases in the current conditions after a downward correction of the pair, which may occur in the second half of the day after the release of data on the US consumer sentiment index. Another false breakout formation in the support area of 1.2451 may maintain bullish momentum in the market. If there is no active growth during the test of this range, I recommend postponing long positions until the update of the day's minimum of 1.2399. An equally important task for the bulls will be to break through and consolidate above the resistance of 1.2512, which will lead to further growth of the pair in the area of highs of 1.2573 and 1.2632, where I recommend fixing the profits.
To open short positions on GBPUSD, you need:
Bears are not particularly in a hurry to return to the market after an unsuccessful attempt to break below the support of 1.2399. Most likely, the focus will be placed on data on the US economy and at the level of 1.2512, where the formation of a false breakout will be an additional signal to open short positions. The first goal of the bears will be the morning support of 1.2451, but the longer-term goal will be the minimum of the day in the area of 1.2399, where I recommend fixing the profits. If there is no movement down from the level of 1.2512 after the US data, it is best to postpone short positions until the maximum is updated. You can safely sell GBP/USD immediately on the rebound from the resistance of 1.2632 in the calculation of a downward correction of 30-40 points within the day.
Signals of indicators:
Moving averages
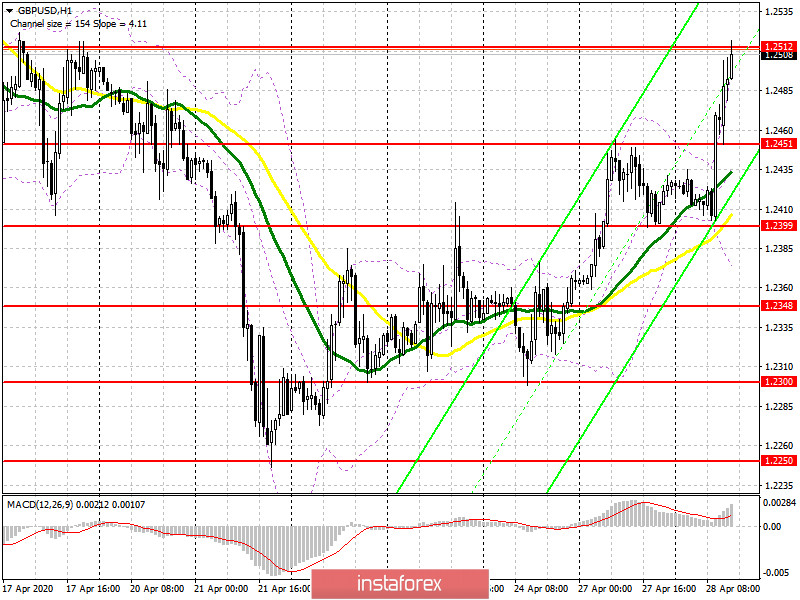
Trading is conducted above the 30 and 50 daily averages, which indicates a further upward correction in the pair.
Note: The period and prices of moving averages are considered by the author on the hourly chart H1 and differ from the general definition of the classic daily moving averages on the daily chart D1.
Bollinger Bands
In the case of a downward correction, support will be provided by the average border of the indicator in the area of 1.2430, and you can buy the pound immediately on the rebound from the lower border in the area of 1.2375.
Description of indicators
InstaForex analytical reviews will make you fully aware of market trends! Being an InstaForex client, you are provided with a large number of free services for efficient trading.


