 Stay
Stay 
Trading Conditions
Products
Tools


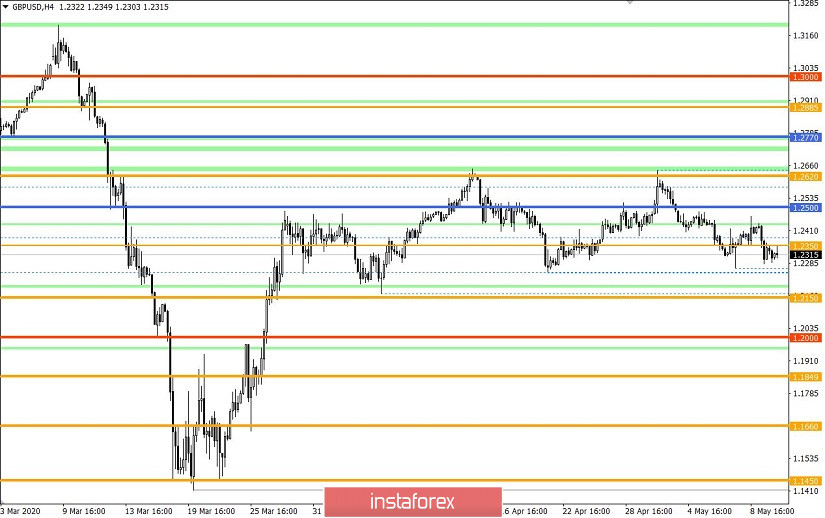
From the point of view of complex analysis, we see another approach to the point of variable support, and now let's talk about the details. The past days were expressed in a downward plan, where the quote gradually formed a measure from the level of 1.2620 towards the variable border of 1.2250, literally repeating the fluctuation of the period 04/15/20-21/04. Is it possible to count this movement as a structure of future downward development? Theoretically possible, only there is one but. For almost 1 and a half months, the movement has a sideways structure of 1.2150 (1.2250) // 1.2350 // 1.2620, which means that in order to start the recovery process, the quote needs to overcome the lower border of the sidewall.
Regarding the theory of downward development, which is often discussed, we can say that the emphasis on the hypothesis comes from the general background, which does not favor the pound in the medium and long-term. The main trend remains downward, and economic factors continue to alarm investors.
Analyzing the past minute, you can see that the downward spiral lasted from the start of the European session to the opening of the American trading session, having a general scale of decline of more than 140 points. After which, there was a local consolidation, which pulled back the quote to a variable level of 1.2350, followed by a slowdown.
In terms of volatility, an acceleration of 15% is recorded relative to the daily average.
The second day in a row, acceleration was recorded, where this time it was possible to exceed the average daily rate by 16%.
Regarding the monitoring of volatility, we see that market activity has been growing in recent days, as well as the average. This is caused by both external factors and speculative jumps.
Now, let's pay attention to the dynamics of volatility, which is gradually normalizing, but still remains extremely active.
Volatility detail
MARCH : Monday - 165 points; Tuesday - 245 points; Wednesday - 172 points; Thursday - 358 points; Friday - 359 points; Monday - 144 points; Tuesday - 271 points; Wednesday - 676 points; Thursday - 354 points; Friday - 522 points; Monday - 267 points; Tuesday - 296 points; Wednesday - 333 points; Thursday - 452 points; Friday - 352 points; Monday - 148 points; Tuesday - 227 points.
APRIL: Wednesday - 108 points; Thursday - 126 points; Friday - 198 points; Monday - 116 points; Tuesday - 217 points; Wednesday - 131 points; Thursday - 122 points; Friday - 42 points; Monday - 87 points; Tuesday - 146 points; Wednesday - 193 points; Thursday - 119 points; Friday - 114 points; Monday - 86 points; Tuesday - 198 points; Wednesday - 111 points; Thursday - 106 points; Friday - 78 points; Monday - 94 points; Tuesday - 113 points; Wednesday - 96 points; Thursday - 213 points.
MAY: Friday - 117 points; Monday - 82 points; Tuesday - 69 points; Wednesday - 116 points; Thursday - 151 points; Friday - 113 points; Monday - 154 points.
The average daily indicator relative to the dynamics of volatility is 133 points [see table of volatility at the end of the article].
Looking at the trading chart in General terms [the daily period], we see exactly the same sideways oscillation that some traders have already dubbed as the "double top" graphic pattern.
The news background of the past day did not contain any noteworthy statistics on Britain and the United States.
In terms of the general informational background, there was a television video at the weekend that British Prime Minister Boris Johnson addressed the nation, which spoke about the gradual removal of restrictive measures caused by the COVID-19 pandemic.
"We can't just cancel the lockdown this week. Instead, we take the first cautious steps that modify our limitations. We will be guided by scientific evidence and public health. And I must emphasize again that all this depends on the fulfillment of a number of important conditions," - Boris Johnson.
In turn, during the new working week, the Prime Minister took care of rebooting the economy, calling on Britons to return to work, but reminding them that it is possible to work remotely due to the continuing risks of infection.
However, UK Foreign Secretary Dominic Raab said Monday that small retailers would return to work at the earliest until June, while other sectors would not return to work until July.
"There are other changes for things like non-essential retail and people returning to school, especially to primary school, which will start no earlier than June 1, depending on the conditions," Raab said.
Today, in terms of the economic calendar, we have the final inflation data in the United States, where they expect a decline from 1.5% to 0.5%. This factor, as an inflation decline, could theoretically push the Fed to new stimulus measures, in particular, lower refinancing rates.
Further development
Analyzing the current trading chart, we see a fluctuation between the level of 1.2350 and the variable support of 1.2250/1.2280. In fact, this kind of slowdown can play into the hands of subsequent acceleration, where work can be built both on local positions and on the main ones.
In terms of the emotional mood of market participants, we see a high coefficient of speculative operations, which can play in favor of volatility.
It can be assumed that price fluctuations in the variable framework of 1.2250 (1.2280) / 1.2350 will be temporary, where the work should be built using the breakdown method of established boundaries. The downward development will be considered the main in case of breakdown of the level of 1.2150 and consolidating the price below it. Otherwise, the 1.5-month flat will continue to form.
Based on the above information, we derive trading recommendations:
- Buy positions have already been considered in case of price consolidation higher than 1.2360, in the direction of 1.2410 - 1.2440.
- Sell positions are considered in case of consolidation lower than 1.2260, towards 1.2150.
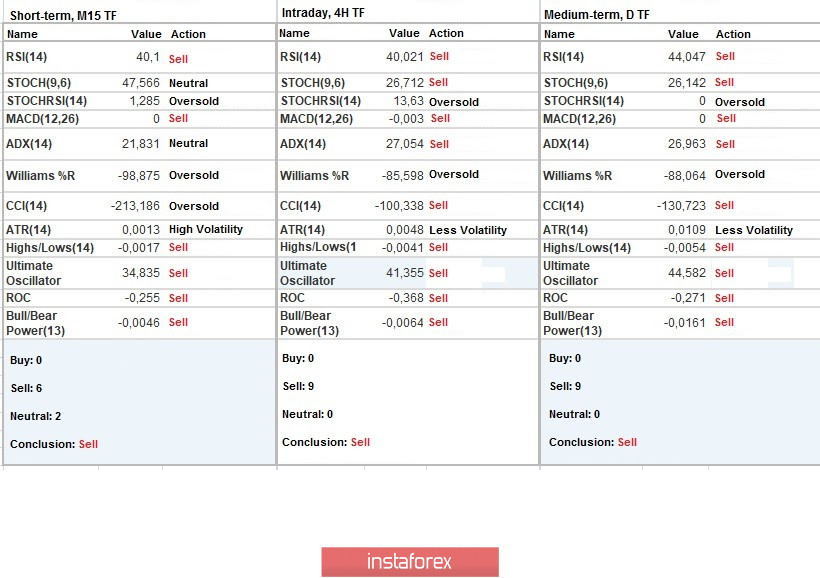
Indicator analysis
Analyzing a different sector of time frames (TF), we see that we have shown technical tools on hourly and daily periods focused on the sell signal, which reflects the general interest of the measure.
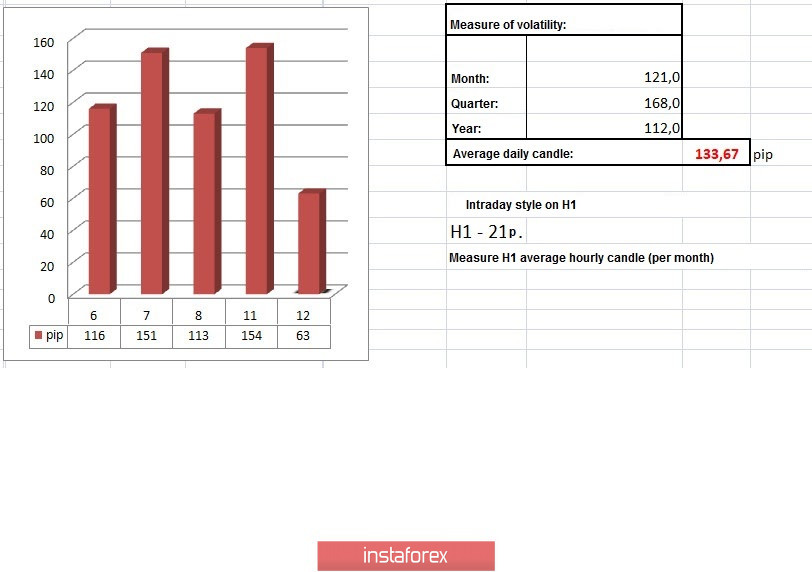
Volatility per week / Measurement of volatility: Month; Quarter; Year
Measurement of volatility reflects the average daily fluctuation, calculated for the Month / Quarter / Year.
(May 12 was built taking into account the time of publication of the article)
The volatility of the current time is 63 points, which is considered a low indicator relative to the average daily value. It can be assumed that activity can increase significantly in the event of a breakdown of the existing range.
Key levels
Resistance zones: 1.2350 **; 1.2500; 1.2620; 1.2725 *; 1.2770 **; 1.2885 *; 1.3000; 1.3170 **; 1.3300 **; 1.3600; 1.3850; 1.4000 ***; 1.4350 **.
Support Areas: 1.2250; 1.2150 **; 1.2000 *** (1.1957); 1.1850; 1.1660; 1.1450 (1.1411); 1.1300; 1.1000; 1,0800; 1.0500; 1.0000.
* Periodic level
** Range Level
*** Psychological level
**** The article is built on the principle of conducting a transaction, with daily adjustment
InstaForex analytical reviews will make you fully aware of market trends! Being an InstaForex client, you are provided with a large number of free services for efficient trading.


