 Stay
Stay 
Trading Conditions
Products
Tools


On Wednesday, the pair unsuccessfully tried for the second time to break the level of 1.0894 - a 50% pullback (presented in a blue dashed line). After that, the price went down almost testing 1.0797 - a 76.4% pullback level (presented in a red dashed line) having gone 78 points down. Today, the price may continue to move down. Economic calendar news for the dollar is expected at 12:30 UTC.
Trend analysis (Fig. 1).
Today, the downward movement may continue from the level of 1.0820 (closing of yesterday's candle) with the target at the support line 1.0793 (presented in a blue bold line). From this level, the price may begin to move upward.
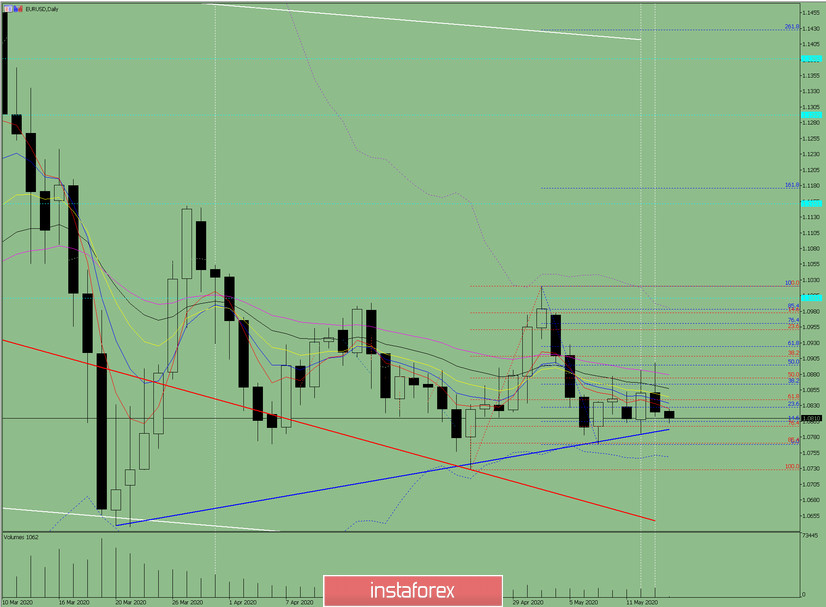
Fig. 1 (daily chart).
Comprehensive analysis:
- Indicator analysis - up;
- Fibonacci levels - up;
- Volumes - up;
- Candlestick analysis - neutral;
- Trend analysis - up;
- Bollinger Lines - down;
- Weekly schedule - up.
General conclusion:
Today, the price may move upward from the support line 1.0793 (presented in a blue bold line) with the target at 1.0864 - a 38.2% retracement level (presented in a blue dashed line). Upon reaching this level, the upward movement is likely to continue with the next target at 1.0894 - a 50.0% pullback level (presented in a blue dashed line)
Another possible scenario is a downward trend from the support line 1.0793 (presented in a blue bold line) with a target at 1.0861 - an 85.4% pullback level (presented in a red dashed line).
InstaForex analytical reviews will make you fully aware of market trends! Being an InstaForex client, you are provided with a large number of free services for efficient trading.


