 Stay
Stay 
Trading Conditions
Products
Tools


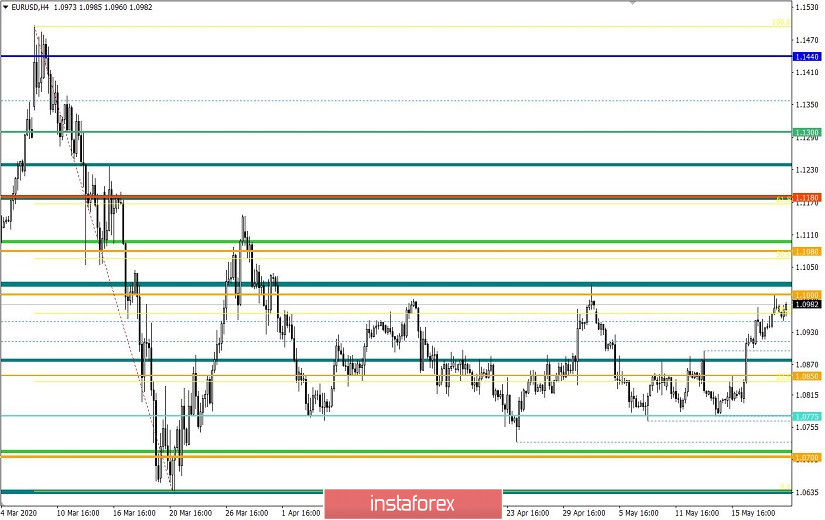
From the point of view of complex analysis, we can see the formation of a flat in the trading chart.
The last trading day was more active than expected. The quote managed to resume the upward movement, during which the psychological level of 1.1000 was affected. Market participants completed the cycle from the lower border of the flat 1.0775 to its upper border 1.1000 in just one trading week. The formation of the flat lasted 6.5 weeks, during which three upward and two downward bars were formed. The resistance in the chart is controlled by the fairly wide flat, which is the product of the compression that occurred earlier [March 9 to April 14, 2020]. The compression of amplitudes then turned into stagnation, which delayed the main direction of the market.
The medium and long-term trading still has a bearish mood, pursuing a 12-year trend in the market, which remains unchanged despite all the bursts of activity.
Analyzing the past trading day in detail, we can see that the round of long positions started at the opening of the daily candle and lasted until the start of the US session. There, the control level of 1.1000 was hit, and a slowdown due to a narrow consolidation was expected.
As discussed in the previous review, the quote will concentrate on the upper border of the flat (1.1000), which will make it possible to switch to a new market tact inside the side corridor.
The trading recommendation from Wednesday regarding local purchase positions coincided 100%.
[Buy positions above 1.0965, towards 1.0990 were opened]
In terms of volatility, the indicator recorded a value close to the daily average, which means that market activity is stable.
Analyzing the daily chart, we can see that the long-term and medium-term trend has a downward slope.
The news published yesterday contained the final data on inflation in Europe, where a decline from 0.7% to 0.3% was recorded, lower than the forecasted 0.4%. Market reaction to the data was practically non-existent, since traders already expected such figures.
The minutes on the Fed's April meeting was also published yesterday, which revealed that the committee foresees extreme uncertainty for the US economy both in the near future and in the medium term.
The possibility of a second wave of COVID-19 infections was also raised, which would lead to massive bankruptcies of companies and a strong impact on the banking sector.
However, the publication of the minutes did not affect the dynamics of the markets in any way, since a lot of comments from Fed representatives thoroughly covered all the information that was missing after the meeting.
Today, a preliminary data on business activity in Europe was published, which showed a record growth from 12.0 to 28.7 in the index of the services sector. In the manufacturing sector, a jump from 33.4 to 39.5 was recorded. The composite index also grew from 13.6 to 30.5.
Market reaction to the EU PMI was also non-existent, possibly because several EU countries, including locomotives such as Germany and France, are celebrating the Ascension Day. Trading volumes are also reduced.
A similar PMI data will be published in the afternoon, but for the United States, where the service sector expects growth from 26.7 to 32.0, while the manufacturing sector expects an increase from 36.1 to 39.0.
A rather optimistic forecast for the United States may push the US dollar up.
Further development
Analyzing the current trading chart, we can see a sluggish, but still a rebound from the border at 1.1000, which returned the quote to the level of 1.0950. Quotes are still at the top of the upward tact, which means that variable fluctuation may still occur before a strong movement in the chart. Prospects are also clear, so by today or tomorrow, a downward move will occur, which will form the third structure of the flat. Only a strong external background, which is currently not available, can prevent the formation of the technical model.
A temporary price fluctuation may occur within the range of 1.0950 / 1.1000. If quotes consolidate below 1.0950, movement may reach the areas 1.0900, 1.0850 and 1.0775.
However, an alternative scenario will happen, if activity increases due to external background. Such a situation will push the quote above the upper border of the flat, and may even lead to a consolidation above 1.1020.
Based on the above information, we derived the following trading recommendations:
- Open buy positions above 1.1020, in the direction of 1.1080, but only if the upper border of the main flat falls and the TF of the market changes.
- Consider selling positions lower than 1.0950, towards 1.0900, 1.0850, or 1.0775.
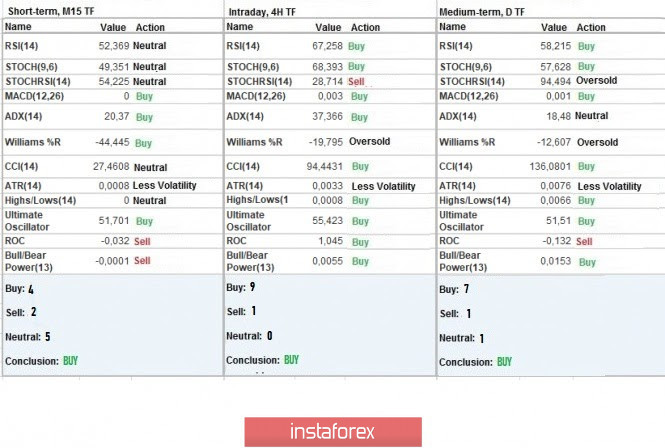
Indicator analysis
Analyzing the different sectors of timeframes (TF), we can see that the indicators of technical instruments signal purchases, relative to the convergence of quotes in the upper border of the flat.
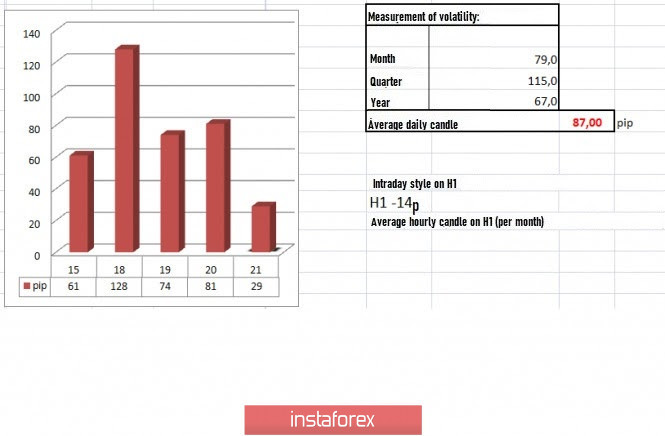
Volatility per week / Measurement of volatility: Month; Quarter Year
The measurement of volatility reflects the average daily fluctuation calculated by Month / Quarter / Year.
(May 21 was built, taking into account the time of publication of the article)
Volatility is currently 29 points, which is 66% lower than the average daily value. Activity will increase if quotes reach the level of 1.1000.
Key levels
Resistance zones: 1,1000 ***; 1.1080 **; 1,1180; 1.1300; 1.1440; 1.1550; 1.1650 *; 1.1720 **; 1.1850 **; 1,2100
Support areas: 1.0850 **; 1.0775 *; 1.0650 (1.0636); 1,0500 ***; 1.0350 **; 1,0000 ***.
* Periodic level
** Range Level
*** Psychological level
InstaForex analytical reviews will make you fully aware of market trends! Being an InstaForex client, you are provided with a large number of free services for efficient trading.


