 Stay
Stay 
Trading Conditions
Products
Tools


The pair traded upwards on Tuesday and tested 1.2360 - a 50% pullback level (presented in a blue dashed line). Today, a downward pullback is possible. Nothing is expected for economic calendar news.
Trend analysis (Fig. 1).
Today, a downward pullback is possible from the level of 1.2326 (closing of yesterday's candle) with the target of 1.2286 - a 38.2% pullback level (presented in a red dotted line). If this level is reached, an upward pullback is possible with the target at the upper fractal 1.2363 (presented in a red dashed line).
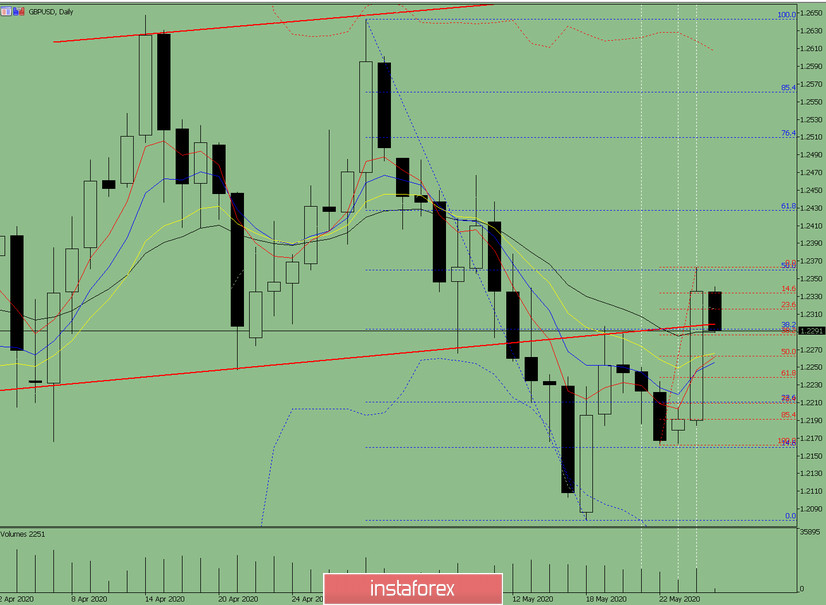
Fig. 1 (daily chart).
Comprehensive analysis:
- Indicator analysis - down;
- Fibonacci levels - down;
- Volumes - down;
- Candlestick analysis - up;
- Trend analysis - up;
- Bollinger Lines - up;
- Weekly schedule - up.
General conclusion:
Today, the price may move downwards with the target of 1.2286 - a 38.2% retracement level (presented in a red dashed line). If this level is reached, an upward pullback is possible, with the target at the upper fractal 1.2363 (presented in a red dashed line).
Another possible scenario is a downward trend from the support line 1.2300 (presented in a red bold line) with the target of 1.2263 - a 38.2% retracement level (presented in a red dashed line).
InstaForex analytical reviews will make you fully aware of market trends! Being an InstaForex client, you are provided with a large number of free services for efficient trading.

