 Stay
Stay 
Trading Conditions
Products
Tools


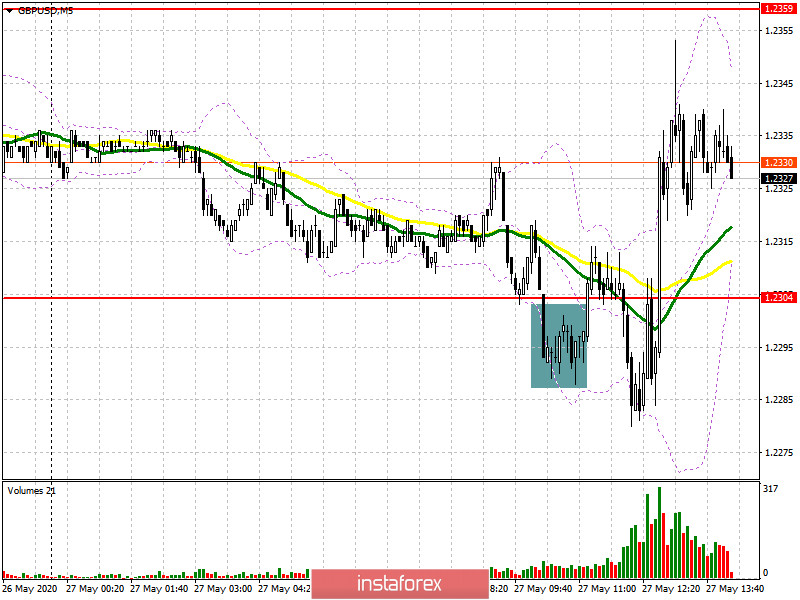
To open long positions on GBPUSD, you need:
In the first half of the day, I paid attention to sales after the breakout and consolidation under the support level of 1.2304, which seemed to happen. If you look at the 5-minute chart, you can clearly see how the bears managed to pick up the level of 1.2304 and gained a foothold under it, which led to the formation of a sell signal. However, there was no major and expected downward movement, and the news from the European Commission returned the demand for risky assets, which led to the demolition of stop orders and the rapid movement of the pound up to the area of this week's maximum. Given that all the levels were broken, they had to be revised. In my opinion, the growth of GBP/USD will continue only after the bulls manage to overcome the area of 1.2350, fixing above which will lead to a further upward trend to the highs of 1.2425 and 1.2370, where I recommend fixing the profits. However, it may also happen that after several unsuccessful attempts to rise above the resistance of 1.2350, the bulls will give up this idea. In this case, it is best to return to long positions only after updating the minimum of 1.2252, since I do not have strong faith in the new support of 1.2290 or buy GBP/USD immediately on the rebound from the area of 1.2206 in the calculation of correction of 20-30 points within the day.
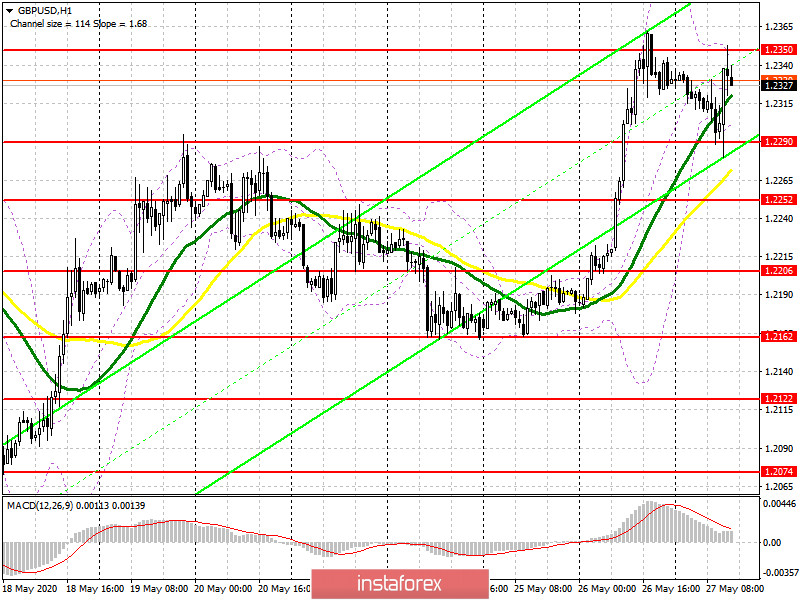
To open short positions on GBPUSD, you need:
The bears have done their best, but the bulls don't want to let the market slip away so easily. At the moment, the next formation of a false breakout at the level of 1.2350 still forms a new signal to sell the pound, and the bears' goal for the second half of the day will be to break the minimum of 1.2290, which will quickly push GBP/USD to the support area of 1.2206 and 1.2162, where I recommend fixing the profits. In the scenario of further growth of the pound on the trend above the resistance of 1.2350, and a sufficiently large volume is required to break through this area, it is best to return to short positions only after testing the maximum of 1.2425 or sell the pound immediately on the rebound from another major resistance – 1.2463.
Signals of indicators:
Moving averages
Trading is conducted in the area of 30 and 50 daily averages, which indicates an active confrontation between buyers and sellers.
Note: The period and prices of moving averages are considered by the author on the hourly chart H1 and differ from the general definition of the classic daily moving averages on the daily chart D1.
Bollinger Bands
A break in the lower border of the indicator around 1.2290 will increase pressure on the pair, while a rise above 1.2350 will lead to a larger upward trend.
Description of indicators
InstaForex analytical reviews will make you fully aware of market trends! Being an InstaForex client, you are provided with a large number of free services for efficient trading.

