 Stay
Stay 
Trading Conditions
Products
Tools


Hello, dear colleagues!
Daily
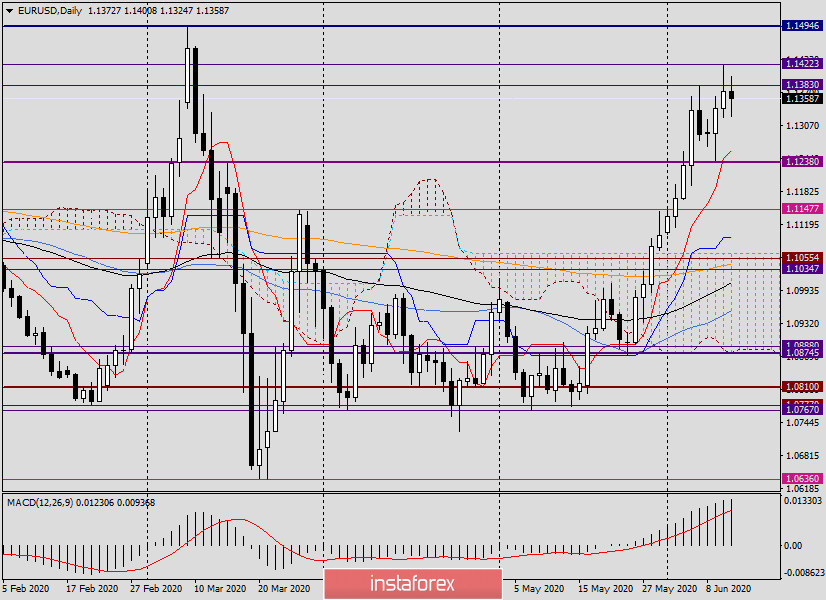
At yesterday's trading, the main currency pair of the Forex market continued to grow, however, the euro bulls failed to close Wednesday's session above the highs of June 5. Yes, attempts to break through the resistance of sellers at 1.1383 turned out to be difficult. Earlier, in previous reviews of this currency pair, the level of 1.1380 was already mentioned as technically very strong.
At today's trading, the bulls for EUR/USD do not leave their intentions to go up this mark, and, judging by their persistence, this option is not excluded. This can be judged since yesterday another very strong level of 1.1420 was tested for strength. However, the pair rebounded from this mark and ended Wednesday's session at 1.1372. I believe that if the upward dynamics continue, the most important psychological and technical level of 1.1500 will become the main reference point for players to increase. In the meantime, a sufficient reason for reaching this mark will be the closing of weekly trading above 1.1383. First, there is a strong resistance of sellers, and secondly, it is at 1.1381 that the weekly 200 exponential average is located.
Let's see what picture is observed at lower time intervals and whether there are interesting and technically sound options for opening deals.
H4
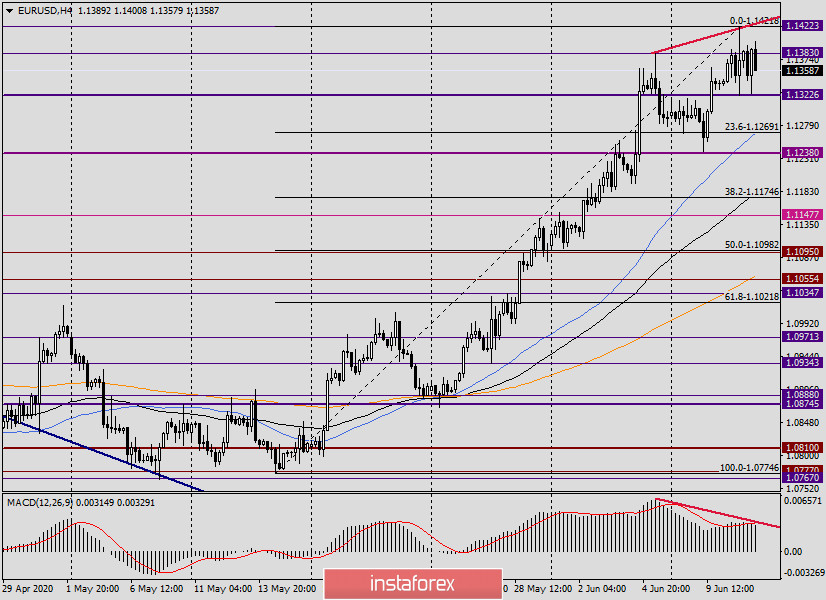
Some interesting technical points can be noted in this timeframe. After the pair rose to 1.1422 and bounced off this mark, consolidation began, which even more resembles an ongoing attempt to continue the upward movement. For example, this is indicated by the previous bullish candle, whose white body is quite large, which indicates the potential for further growth.
At the same time, it is impossible not to note the overbought EUR/USD, which is indicated by the bearish divergence of the MACD indicator. I have repeatedly drawn attention to the fact that it is not necessary to trade on divergences, they should be perceived only as an additional signal for opening positions in one direction or another.
The moving averages: 50 MA, 89 EMA, and 200 EMA have confidently turned up after the price, supporting the growth, and indicate its further potential. Since at the moment the rise ended at 1.1422, I stretched the grid of the Fibonacci tool to the rise of 1.0775-1.1422. As a rule, with such a pronounced and strong trend, corrections are insignificant and limited to the first pullback level of 23.6 Fibo. It is characteristic that under this Fibo level there is a 50 simple moving average, which in the case of a decline to the area of 1.1270 can provide additional and very tangible support to the pair and return it to growth. On the other hand, up to 1.1270 as much as 100 points, and it is not a fact that the bears on the pair will have the strength to conduct such a significant pullback.
H1
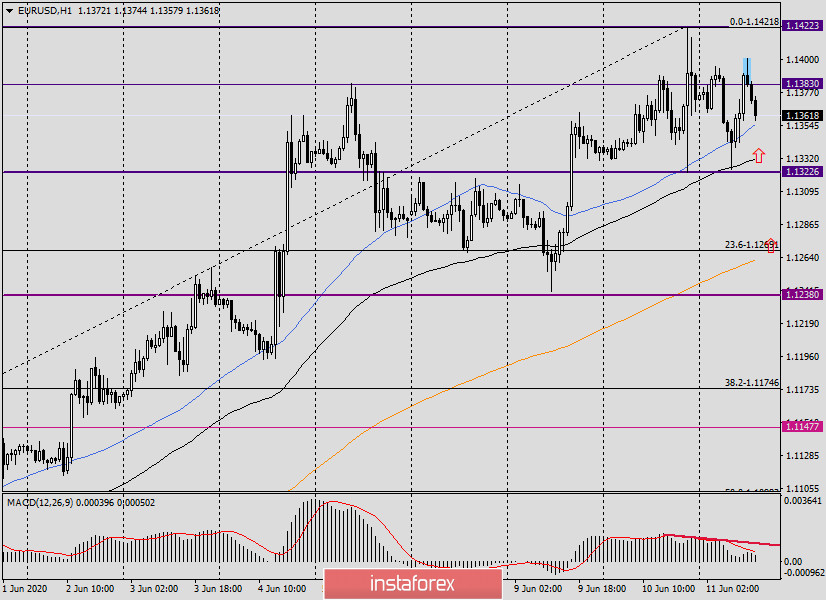
But in this time period, the moving averages show themselves in all their glory. We are talking about 50 MA and 89 EMA, which stopped the corrective pullback, giving the quote strong support. However, there was a candle (highlighted), which may well be considered a reversal and will send the pair to a second meeting with 50 MA and 89 EMA. If these moves are broken, then the probability of a corrective pullback to 1.1270 will become much stronger. Taking into account the fact that the hourly 200 EMA passes slightly below 1.1270, as well as the technical level of 1.1380, which has been repeatedly designated, purchases from the price zone of 1.1275-1.1240 technically look quite reasonable and attractive at the price. But whether the pair will fall to the selected zone is unknown. We will hope for this and prepare to open long positions on EUR/USD after falling to the area of 1.1275-1.1240. Earlier and risky purchases can be tried from the price zone of 1.1355-1.1333, where there are 50 MA with 89 EMA, and also passes the support level of 1.1322, which has already twice provided strong support to the price.
In general, the main trading idea for EUR/USD remains trend positioning. Alternatively, purchases can be opened from the prices highlighted in this review.
Good luck!
InstaForex analytical reviews will make you fully aware of market trends! Being an InstaForex client, you are provided with a large number of free services for efficient trading.

